

Question: 2 12.5 points The following chart shows how costs flow through a business as a product is manufactured. All boxes in the chart show
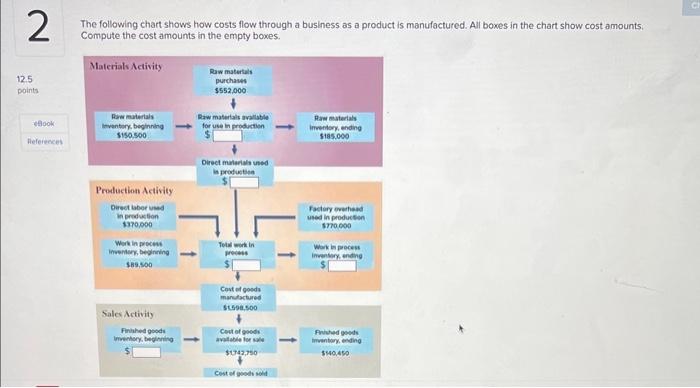
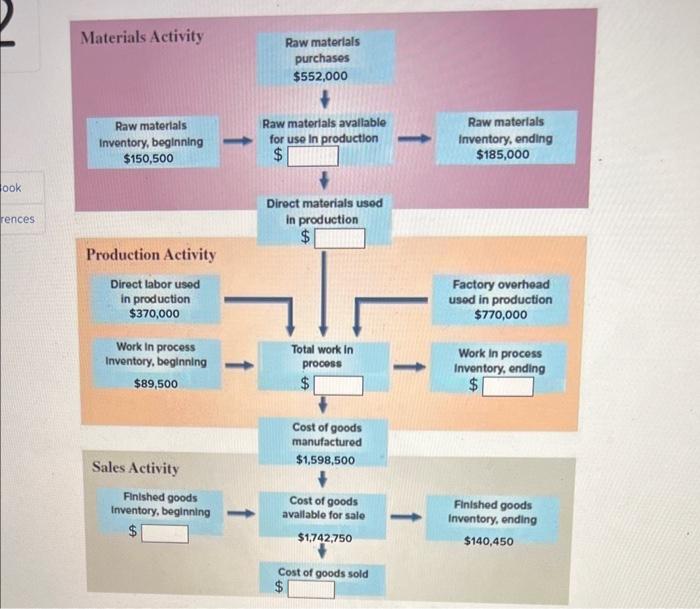
2 12.5 points The following chart shows how costs flow through a business as a product is manufactured. All boxes in the chart show cost amounts. Compute the cost amounts in the empty boxes. Materials Activity Raw materials purchases $552,000 eBook References Raw materials Inventory, beginning $150.500 Production Activity Direct labor used in production $370,000 Inventory, beginning $89,500 Sales Activity Raw materials available for use in production Raw materials Inventory, ending $185,000 Direct materials used Cost of goods manufactured $1.598.500 Factory overhead used in production $770,000 Work in process Finished goods Inventory, beginning Cost of goods Finished goods Inventory, ending $1742,750 Cost of goods sold $140,450 ook Materials Activity Raw materials purchases $552,000 Raw materials Inventory, beginning $150,500 Raw materials available for use in production $ Raw materials Inventory, ending $185,000 rences: Production Activity Direct labor used in production $370,000 Direct materials used in production Total work in process Factory overhead used in production $770,000 Work In process Inventory, ending Work In process Inventory, beginning $89,500 $ Sales Activity Finished goods Inventory, beginning $ Cost of goods manufactured $1,598,500 Cost of goods available for sale Finished goods Inventory, ending $140,450 $1,742,750 Cost of goods sold +A $
Step by Step Solution
There are 3 Steps involved in it

Get step-by-step solutions from verified subject matter experts