

Question: 2. 2: Data Table Financial ratios: Profitability. The financial statements for Tyler Toys, Inc. are shown in the popup window: . Calculate the profit margin,
2.
2: Data Table
Financial ratios: Profitability. The financial statements for Tyler Toys, Inc. are shown in the popup window: . Calculate the
profit margin, return on assets, and return on equity for 2013 and 2014 for Tyler Toys. Should any of these ratios or the
change in a ratio warrant concern for the managers of Tyler Toys or the shareholders?
2
What is the profit margin for 2014?
% (Round to two decimal places.)
What is the profit margin for 2013?
% (Round to two decimal places.)
What is the return on assets for 2014?
% (Round to two decimal places.)
What is the return on assets for 2013?
% (Round to two decimal places.)
What is the return on equity for 2014?
% (Round to two decimal places.)
What is the return on equity for 2013?
% (Round to two decimal places.)
Should any of these ratios or the change in a ratio warrant concern for the managers of Tyler Toys or the shareholders?
(Select the best response.)
A. These ratios indicate a somewhat weak firm performance for the equity holders with an ROE of over
63.83% for 2013.
B. These ratios indicate a somewhat strong firm performance for the equity holders with an ROE of over
63.83% for 2014.
C. These ratios indicate a somewhat weak firm performance for the equity holders with an ROE of over
63.83% for 2014.
D. These ratios indicate a somewhat strong firm performance for the equity holders with an ROE of over
63.83% for 2013.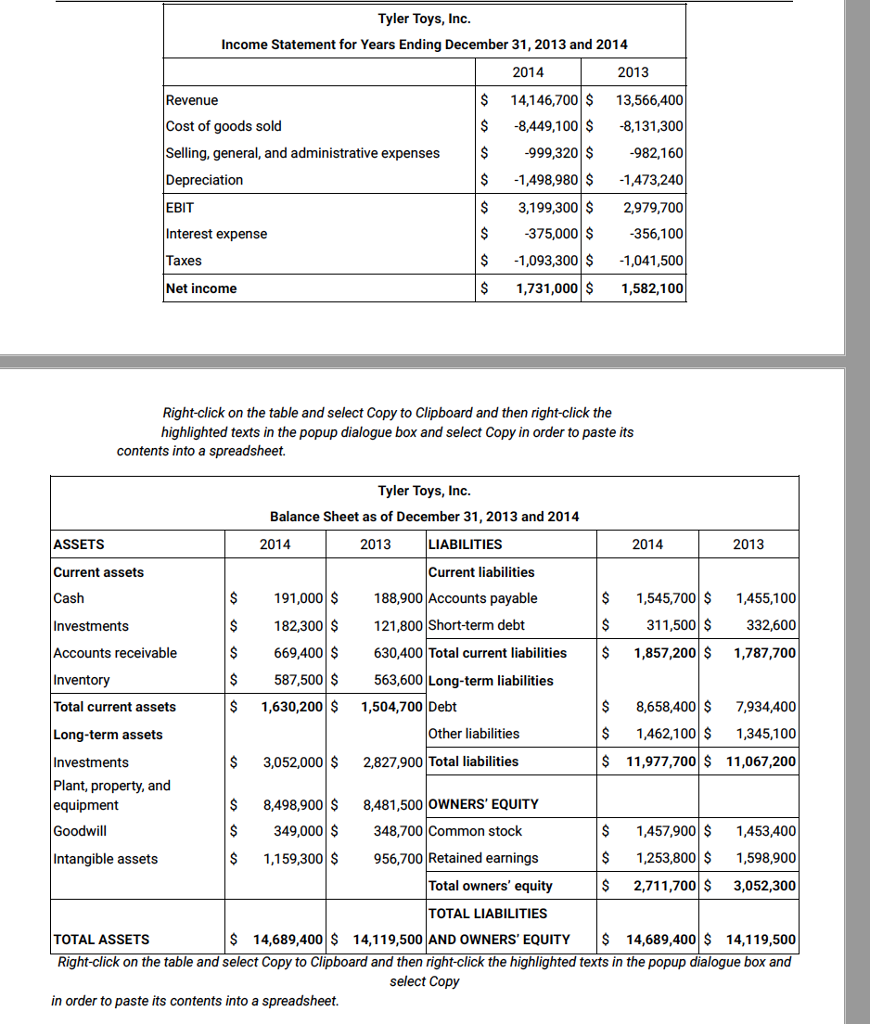
Tyler Toys, Inc. Income Statement for Years Ending December 31, 2013 and 2014 2014 2013 $14,146,700$ 13,566,400 $-8,449,100$ -8,131,300 Revenue Cost of goods sold Selling, general, and administrative expenses$-999,320 $-982,160 Depreciation EBIT Interest expense Taxes Net income $-1,498,980 $ 1,473,240 $3,199,300 $ 2,979,700 $375,000 356,100 $-1,093,300S 1,041,500 $1,731,000$ 1,582,100 Right-click on the table and select Copy to Clipboard and then right-click the highlighted texts in the popup dialogue box and select Copy in order to paste its contents into a spreadsheet. Tyler Toys, Inc Balance Sheet as of December 31, 2013 and 2014 ASSETS Current assets Cash Investments Accounts receivable Inventory Total current assets Long-term assets Investments Plant, property, and equipment Goodwill Intangible assets 2014 LIABILITIES 2014 2013 Current liabilities $191,000 188,900 Accounts payable $182,300 121,800 Short-term debt $669,400 $ 630,400 Total current liabilities S 1,857,200 $ 1,787,700 $1,545,700 $ 1,455,100 $311,500 332,600 $587,500 $563,600 Long-term liabilities $1,630,200$ 1,504,700 Debt $8,658,400S 7,934,400 $1,462,10S 1,345,100 $ 11,977,700 11,067,200 Other liabilities $3,052,000 2,827,900 Total liabilities $ 8,498,900 8,481,500 OWNERS' EQUITY $349,000 348,700 Common stock $1.159,300 $ 956,700Retained earnings $1,457,900 $ 1,453,400 $1253,800 $ 1,598,900 $ 2,711,700 $ 3,052,300 Total owners' equity TOTAL LIABILITIES TOTAL ASSETS $ 14,689,400 $ 14,119,500 AND OWNERS' EQUITY 14,689,400 $ 14,119,500 Right-click on the table and select Copy to Clipboard and then right-click the highlighted texts in the popup dialogue box and select Copy in order to paste its contents into a spreadsheet
Step by Step Solution
There are 3 Steps involved in it

Get step-by-step solutions from verified subject matter experts