

Question: 2 20 pts Look at the table below M Y Y x2 x1 D Number of Drinks 2 4 6 10 A Blood Alcohol Concentration
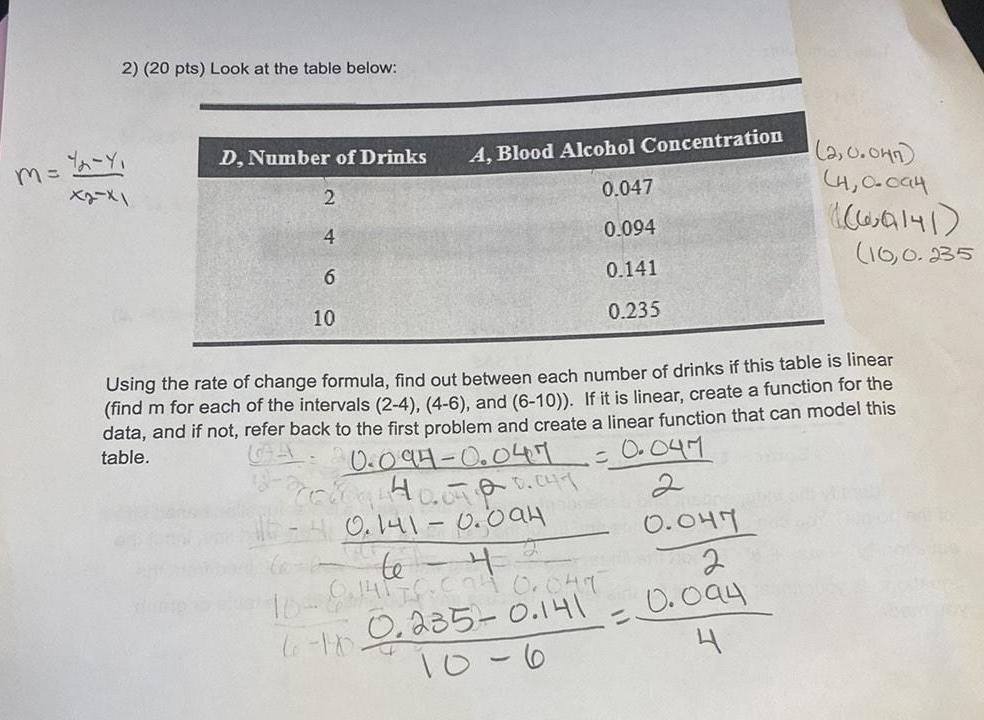

2 20 pts Look at the table below M Y Y x2 x1 D Number of Drinks 2 4 6 10 A Blood Alcohol Concentration 0 047 0 094 0 141 0 235 2 0 047 4 0 094 Using the rate of change formula find out between each number of drinks if this table is linear find m for each of the intervals 2 4 4 6 and 6 10 If it is linear create a function for the data and if not refer back to the first problem and create a linear function that can model this table 0 047 0 094 0 047 CE240 00 0 047 0 141 0 094 te 4 16 6 14176 024 0 049 6 1x 0 235 0 141 10 6 0 047 2 0 094 4 wa141 10 0 235
Step by Step Solution
There are 3 Steps involved in it
1 Expert Approved Answer
Step: 1 Unlock

Question Has Been Solved by an Expert!
Get step-by-step solutions from verified subject matter experts
Step: 2 Unlock
Step: 3 Unlock