

Question: 2. (21 points) For this question, please use Python for the computational parts and provide relevant pieces of code, label and give titles to your
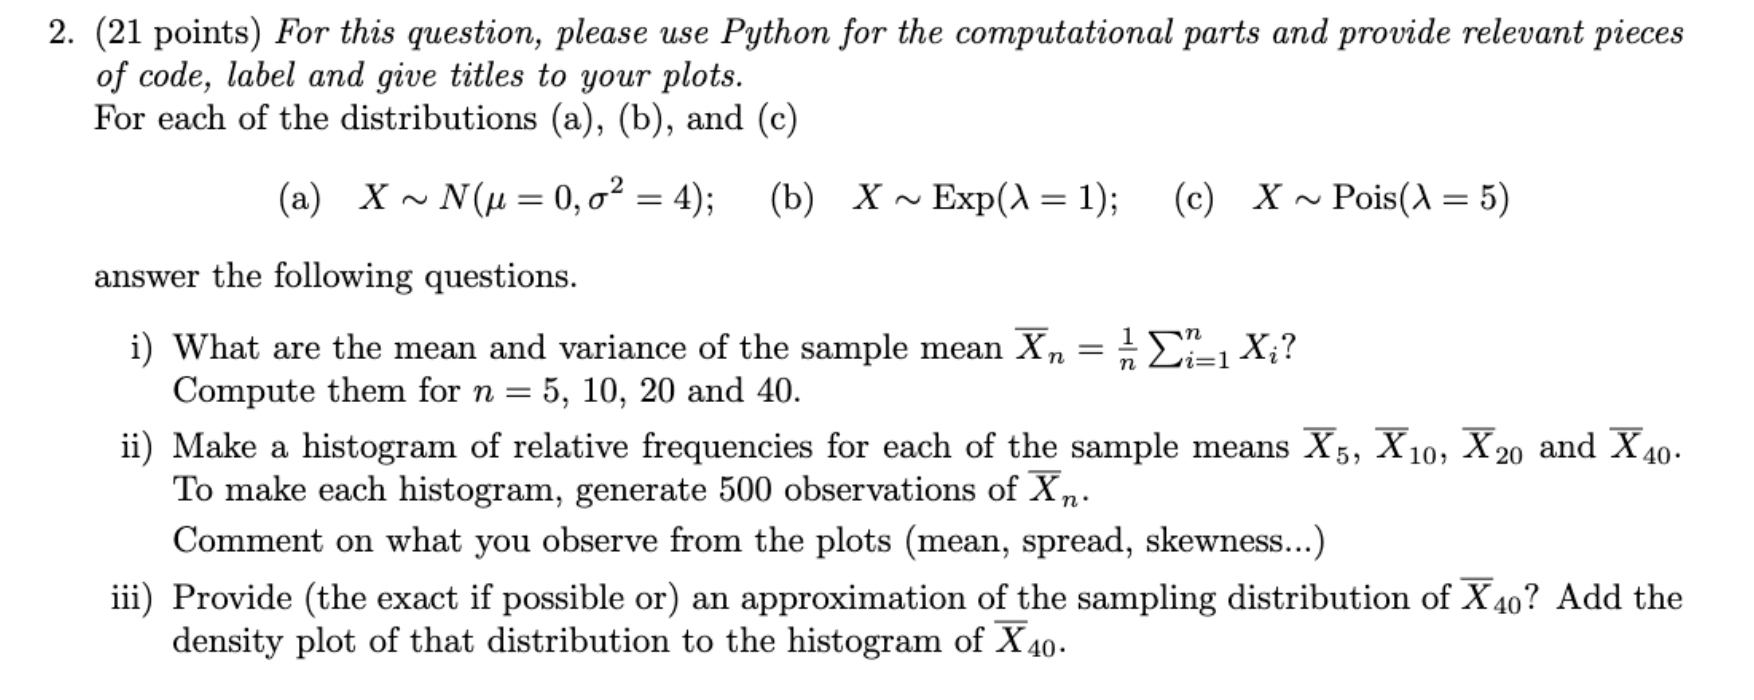
2. (21 points) For this question, please use Python for the computational parts and provide relevant pieces of code, label and give titles to your plots. For each of the distributions (a), (b), and (c) (a) X N N(u = 0,02 = 4); (b) X ~ Exp(/\\ = 1); (c) X ~ Pois()\\ = 5) answer the following questions. i) What are the mean and variance of the sample mean X" = % 221:1 Xi? Compute them for n = 5, 10, 20 and 40. ii) Make a histogram of relative frequencies for each of the sample means X5, X10, X20 and X40. To make each histogram, generate 500 observations of X n. Comment on what you observe from the plots (mean, spread, skewness...) iii) Provide (the exact if possible or) an approximation oghe sampling distribution of X40? Add the density plot of that distribution to the histogram of X 40
Step by Step Solution
There are 3 Steps involved in it

Get step-by-step solutions from verified subject matter experts