

Question: 2. (25 points) Statistical Process Control THE DATA IN THE FOLLOWING TABLES ARE AVAILABLE IN AN EXCEL SPREADSHEET (HWZQuality Data.xlsx) The Los Angeles Metro Rail
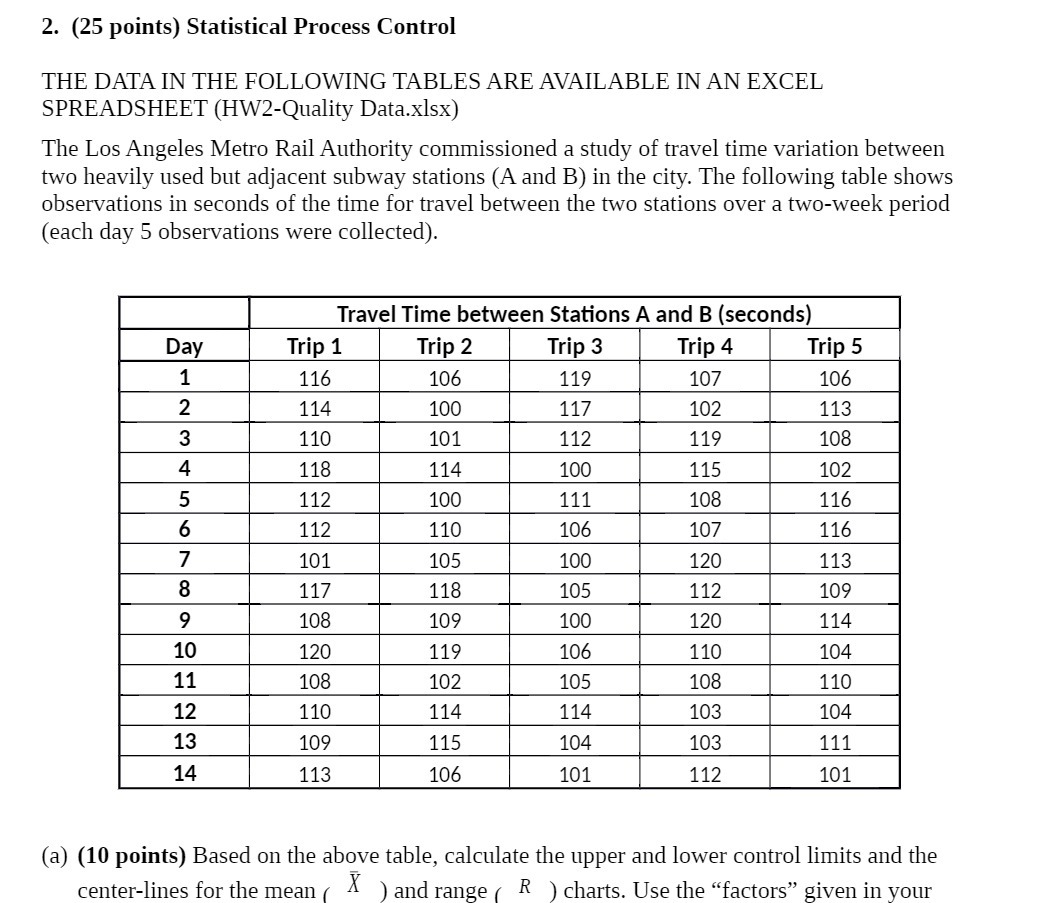
2. (25 points) Statistical Process Control THE DATA IN THE FOLLOWING TABLES ARE AVAILABLE IN AN EXCEL SPREADSHEET (HWZQuality Data.xlsx) The Los Angeles Metro Rail Authority commissioned a study of travel time variation between two heavily used but adjacent subway stations (A and B) in the city. The foowing table shows observations in seconds of the time for travel between the two stations over a two-week period (each day 5 observations were collected). 0 NH Travel Time between Stations A and B (seconds) Trip 1 Trip 2 Ih H 0* 114 110 106 100 101 45-60 118 112 114 100 ll NI | ND H I'I'H COO most: I'I'I'l OOH 1442-4:- 112 101 117 108 120 108 110 109 113 center-lines for the mean ( 110 105 118 109 119 102 114 115 106 ) and range f R ) charts. Use the \"factors\" given in your 120 114 (a) (10 points) Based on the above table, calculate the upper and lower control limits and the
Step by Step Solution
There are 3 Steps involved in it

Get step-by-step solutions from verified subject matter experts