

Question: 2 . 2.The table below shows data on quarterly demand for three years. (30 scores Quarter Period Demand 81000 13 000 14 161000 34 000
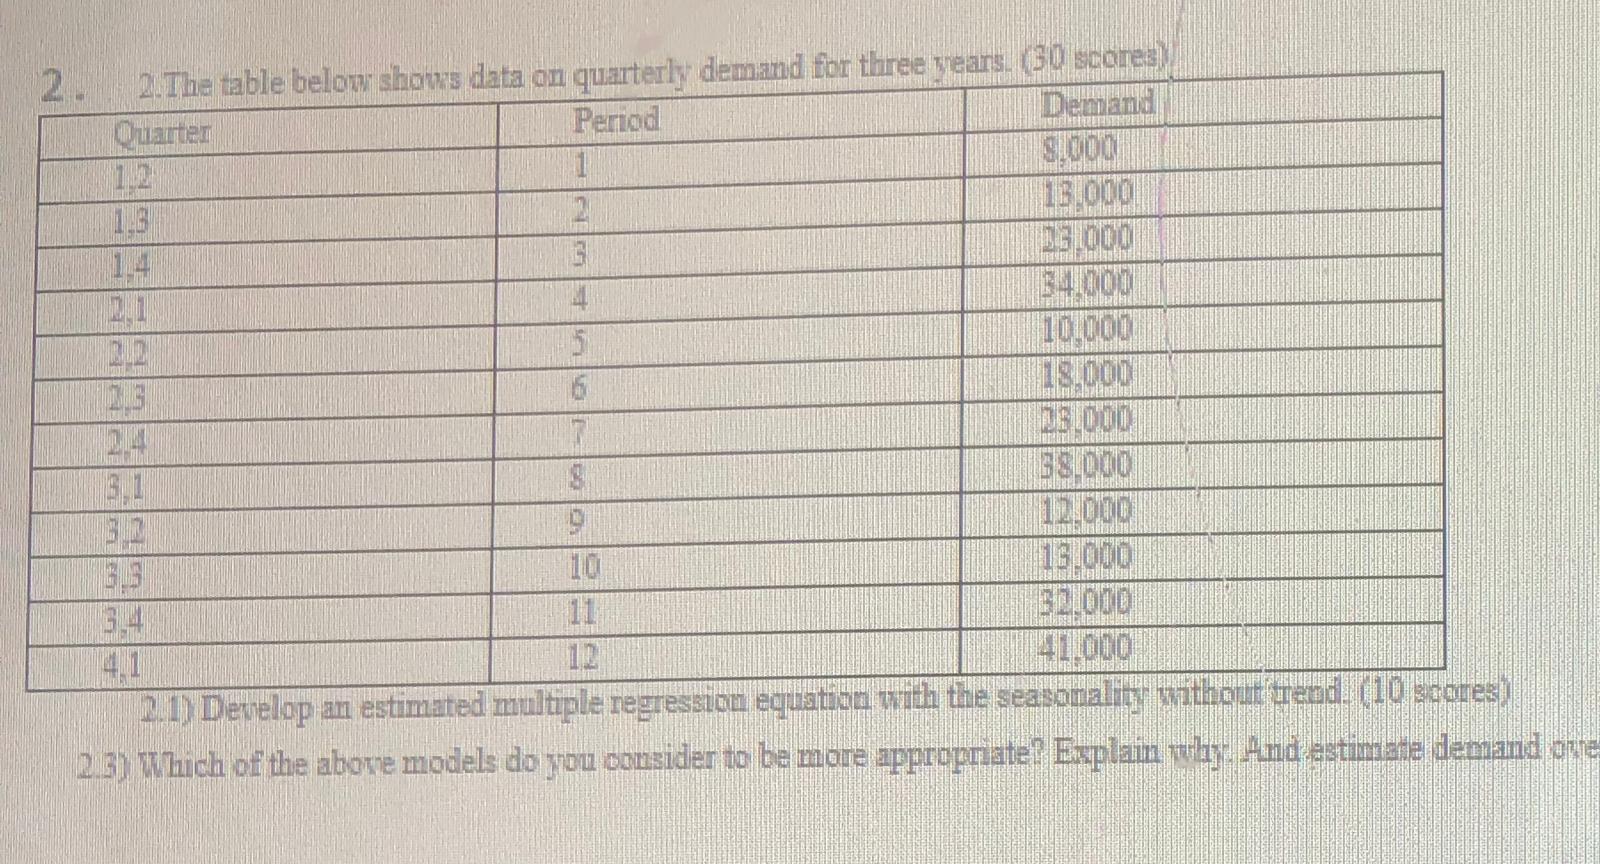
2 . 2.The table below shows data on quarterly demand for three years. (30 scores Quarter Period Demand 81000 13 000 14 161000 34 000 10.060 18.000 38 000 12090 La 10 15 000 US 11 12 41000 (21) Develop an estimated multiple regression equation with the seasonality without trend. (10 scores) 2 3) Which of the above models do you consider to be more appropriate? Explain why, And estimate demand ove
Step by Step Solution
There are 3 Steps involved in it
1 Expert Approved Answer
Step: 1 Unlock

Question Has Been Solved by an Expert!
Get step-by-step solutions from verified subject matter experts
Step: 2 Unlock
Step: 3 Unlock