

Question: plz help , I want excel file 2.The table below shows data on quarterly demand for three years. (30 scores) Quarter Period Demand 1,2 8,000
plz help , I want excel file
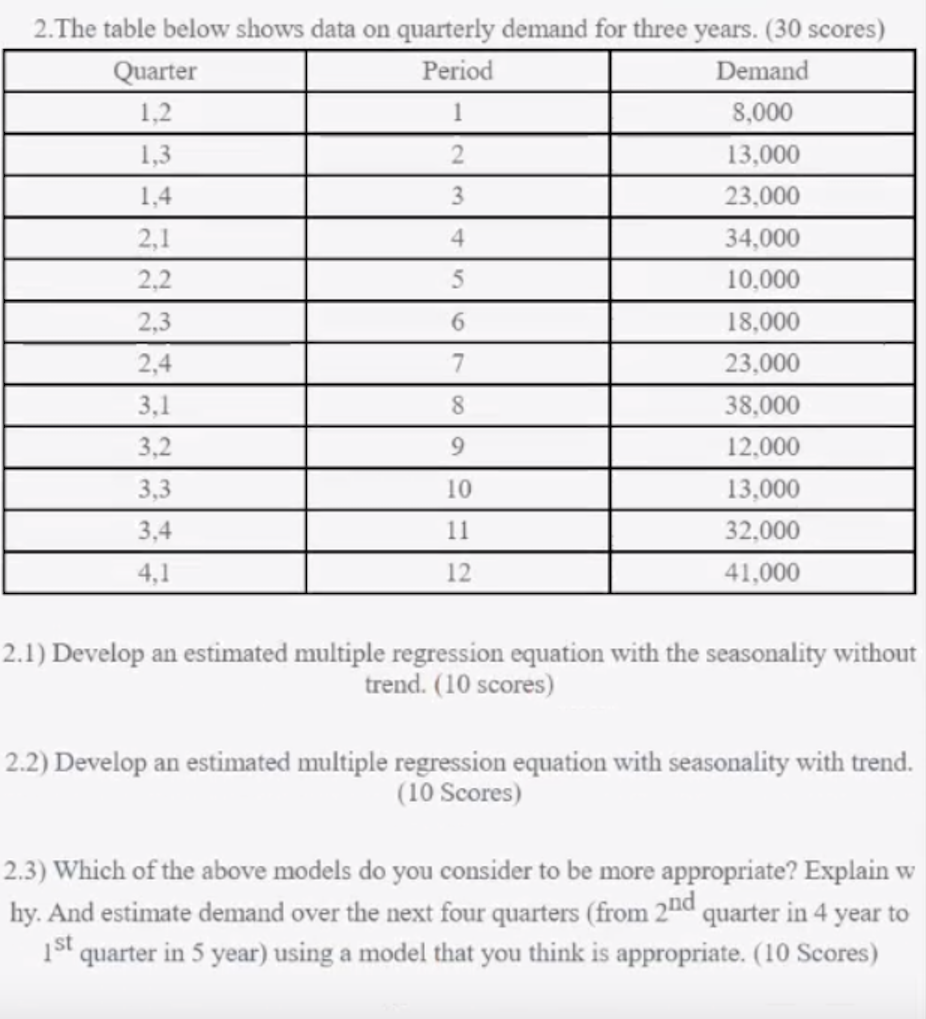
2.The table below shows data on quarterly demand for three years. (30 scores) Quarter Period Demand 1,2 8,000 1.3 2 13,000 1,4 3 23,000 2,1 4 34,000 2.2 5 10,000 2,3 6 18,000 2,4 7 23,000 3.1 8 38,000 3,2 9 12.000 3.3 10 13,000 3.4 11 32,000 4,1 12 41,000 2.1) Develop an estimated multiple regression equation with the seasonality without trend. (10 scores) 2.2) Develop an estimated multiple regression equation with seasonality with trend. (10 Scores) 2.3) Which of the above models do you consider to be more appropriate? Explain w hy. And estimate demand over the next four quarters (from 2nd quarter in 4 year to ist quarter in 5 year) using a model that you think is appropriate. (10 Scores) 2.The table below shows data on quarterly demand for three years. (30 scores) Quarter Period Demand 1,2 8,000 1.3 2 13,000 1,4 3 23,000 2,1 4 34,000 2.2 5 10,000 2,3 6 18,000 2,4 7 23,000 3.1 8 38,000 3,2 9 12.000 3.3 10 13,000 3.4 11 32,000 4,1 12 41,000 2.1) Develop an estimated multiple regression equation with the seasonality without trend. (10 scores) 2.2) Develop an estimated multiple regression equation with seasonality with trend. (10 Scores) 2.3) Which of the above models do you consider to be more appropriate? Explain w hy. And estimate demand over the next four quarters (from 2nd quarter in 4 year to ist quarter in 5 year) using a model that you think is appropriate. (10 Scores)
Step by Step Solution
There are 3 Steps involved in it

Get step-by-step solutions from verified subject matter experts