

Question: 2 4 Factors for Calculating Three Sigma Limits for the X-Chart and R-hart Size of Factor for UCL und Factor for Factor for Sample LCL
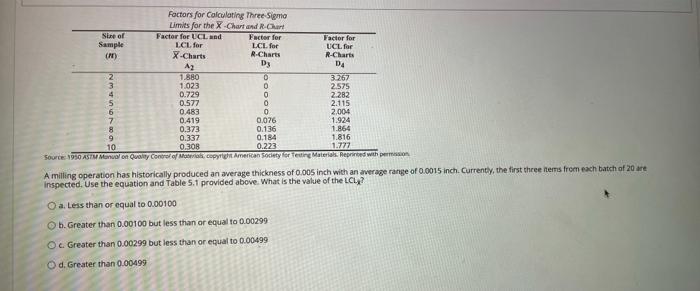
2 4 Factors for Calculating Three Sigma Limits for the X-Chart and R-hart Size of Factor for UCL und Factor for Factor for Sample LCL for LCL for UCL for () X-Charts R-Charts R-Charts Az D3 D4 1.880 0 3.267 3 1.023 0 2.575 0.729 O 2.282 5 0.577 0 2.115 6 0.483 0 2.004 7 0.419 0.076 1.924 8 0.373 0.136 1.864 9 0.337 0.184 1.816 10 0.308 0.223 1.777 Source: 1950 ASTM Manual on Quality Control Mail. copyright American Society for eding Materials. Reprinted with A milling operation has historically produced an average thickness of 0.005 inch with an average range of 0.0015 inch. Currently, the first three mers from each batch of 20 are Inspected. Use the equation and Table 5.1 provided above. What is the value of the LCL? a. Less than or equal to 0.00100 b. Greater than 0.00100 but less than or equal to 0.00299 O Greater than 0.00299 but less than or equal to 0.00499 d. Greater than 0.00499
Step by Step Solution
There are 3 Steps involved in it

Get step-by-step solutions from verified subject matter experts