Question: Need help with B. Homework: M2 Assignment 2 Save 5 of 5 (4 complete) HW Score: 73.95%, 45.85 of 62 pts Score: 0 of 14

Need help with B. Need help with B. Homework: M2 Assignment 2 Save
Need help with B. Homework: M2 Assignment 2 Save
Homework: M2 Assignment 2 Save 5 of 5 (4 complete) HW Score: 73.95%, 45.85 of 62 pts Score: 0 of 14 pts Problem 24 Question Help The production manager at Sunny Soda, Inc., is interested in tracking the quality of the company's 12-ounce bottle filling line. The bottles must be filled within the tolerances set for this product because the dietary information on the label shows 12 ounces as the serving size. The design standard for the product calls for a full level of 12 10.10 ounces. The manager collected the accompanying sample data (in fluid Ounces per bottle) on the production process. !!! Click the icon to view the sample data. Click the icon to view the table of factors for calculating three sigma limits for the x-chart and R.chart. Design an R. and anx-chart for this process The UCLR equals 0.3498 ounces and the LCLR equals ounces (Enter your responses rounded to three decimal places) The UCL, equals 12.116 ounces and the LCL, quels 11.892 ounces (Enter your responses rounded to three decimal places) a. Are the process average and range in statistical control? The process average is in statistical control and the process range is in statistical control b. Is the process capable of meeting the design standard at four sigma quality Explain. The lis equal to the process capable. (Enter your response rounded to the decimal places) Enter your answer in the answer box and then click Check Answer All parts showing Clear All Check Answer MacBook Air V ULIPIGO HW Score! Soda, In ause the collecte The bottles mu standard for the poss i Data Table mple data le of facto Bottle Sample mis proces es and the 12.10 12.01 11.90 11.93 12.02 11.96 12.08 ms and the range in st 12.07 11.95 11.87 11.99 12.09 11.97 11.89 11.92 12.06 12.09 12.10 12.09 12.02 12.08 11.94 11.89 12.11 12.05 11.96 12.08 11.99 11.90 12.10 12.01 11.90 11.95 12.04 12.12 12.01 12.05 12.05 11.93 11.94 12.08 11.94 11.98 11.90 12.05 11.91 12.10 12.03 12.01 12.05 12.03 11.95 statistical GO AWN 11.87 oting the de rocess 11.93 12.09 11.98 12.10 Print Done er box and Clear All Check at Sunny Soda, Inc., is interested in tracking the quality of the company's 12-ounce bottle filling line. The bottles mus duct because the dietary information on the label shows 12 ounces as the serving size. The design standard for the manager collected the accompanying sample data fin fluid Ounces per bottle on the production process More Info Factors for calculating three-sigma limits for the x-chart and R-chart Factor for LCL for R-Chart (D3) Oo . Size of Sample Factor for UCL and LCL (n) for x-chart (A2) 1.880 1.023 0.729 0.577 0.483 0.419 0.373 0.337 0.308 oo Factor for UCL for R-Chart (DA) 3.267 2.575 2.282 2.115 2.004 1.924 1.864 1.816 1.777 ble 0.076 0.136 0.184 0.223 Done the answer box and then click Check Answer. Check Ans

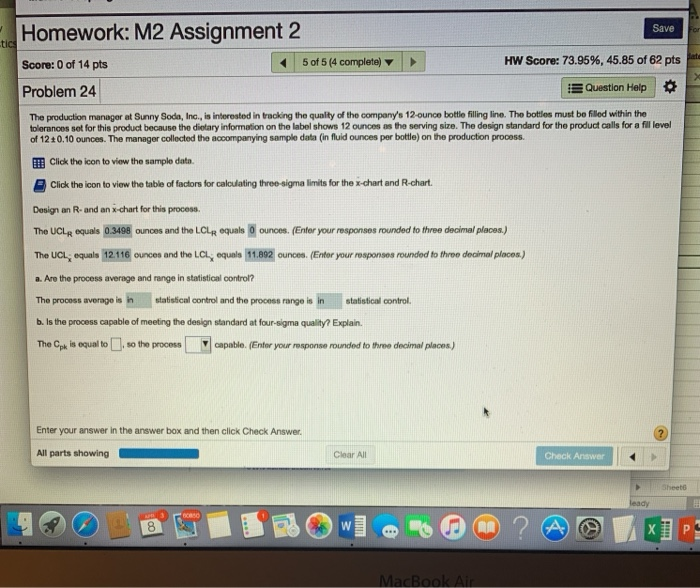
Step by Step Solution

There are 3 Steps involved in it

1 Expert Approved Answer
Step: 1 Unlock blur-text-image
Question Has Been Solved by an Expert!

Get step-by-step solutions from verified subject matter experts

Step: 2 Unlock
Step: 3 Unlock

Students Have Also Explored These Related General Management Questions!