

Question: 2. (5 possible points) Below is an incomplete graph of foramen magnum index (FMI) and average cranial capacity (ACC) (ccm). The graph has been
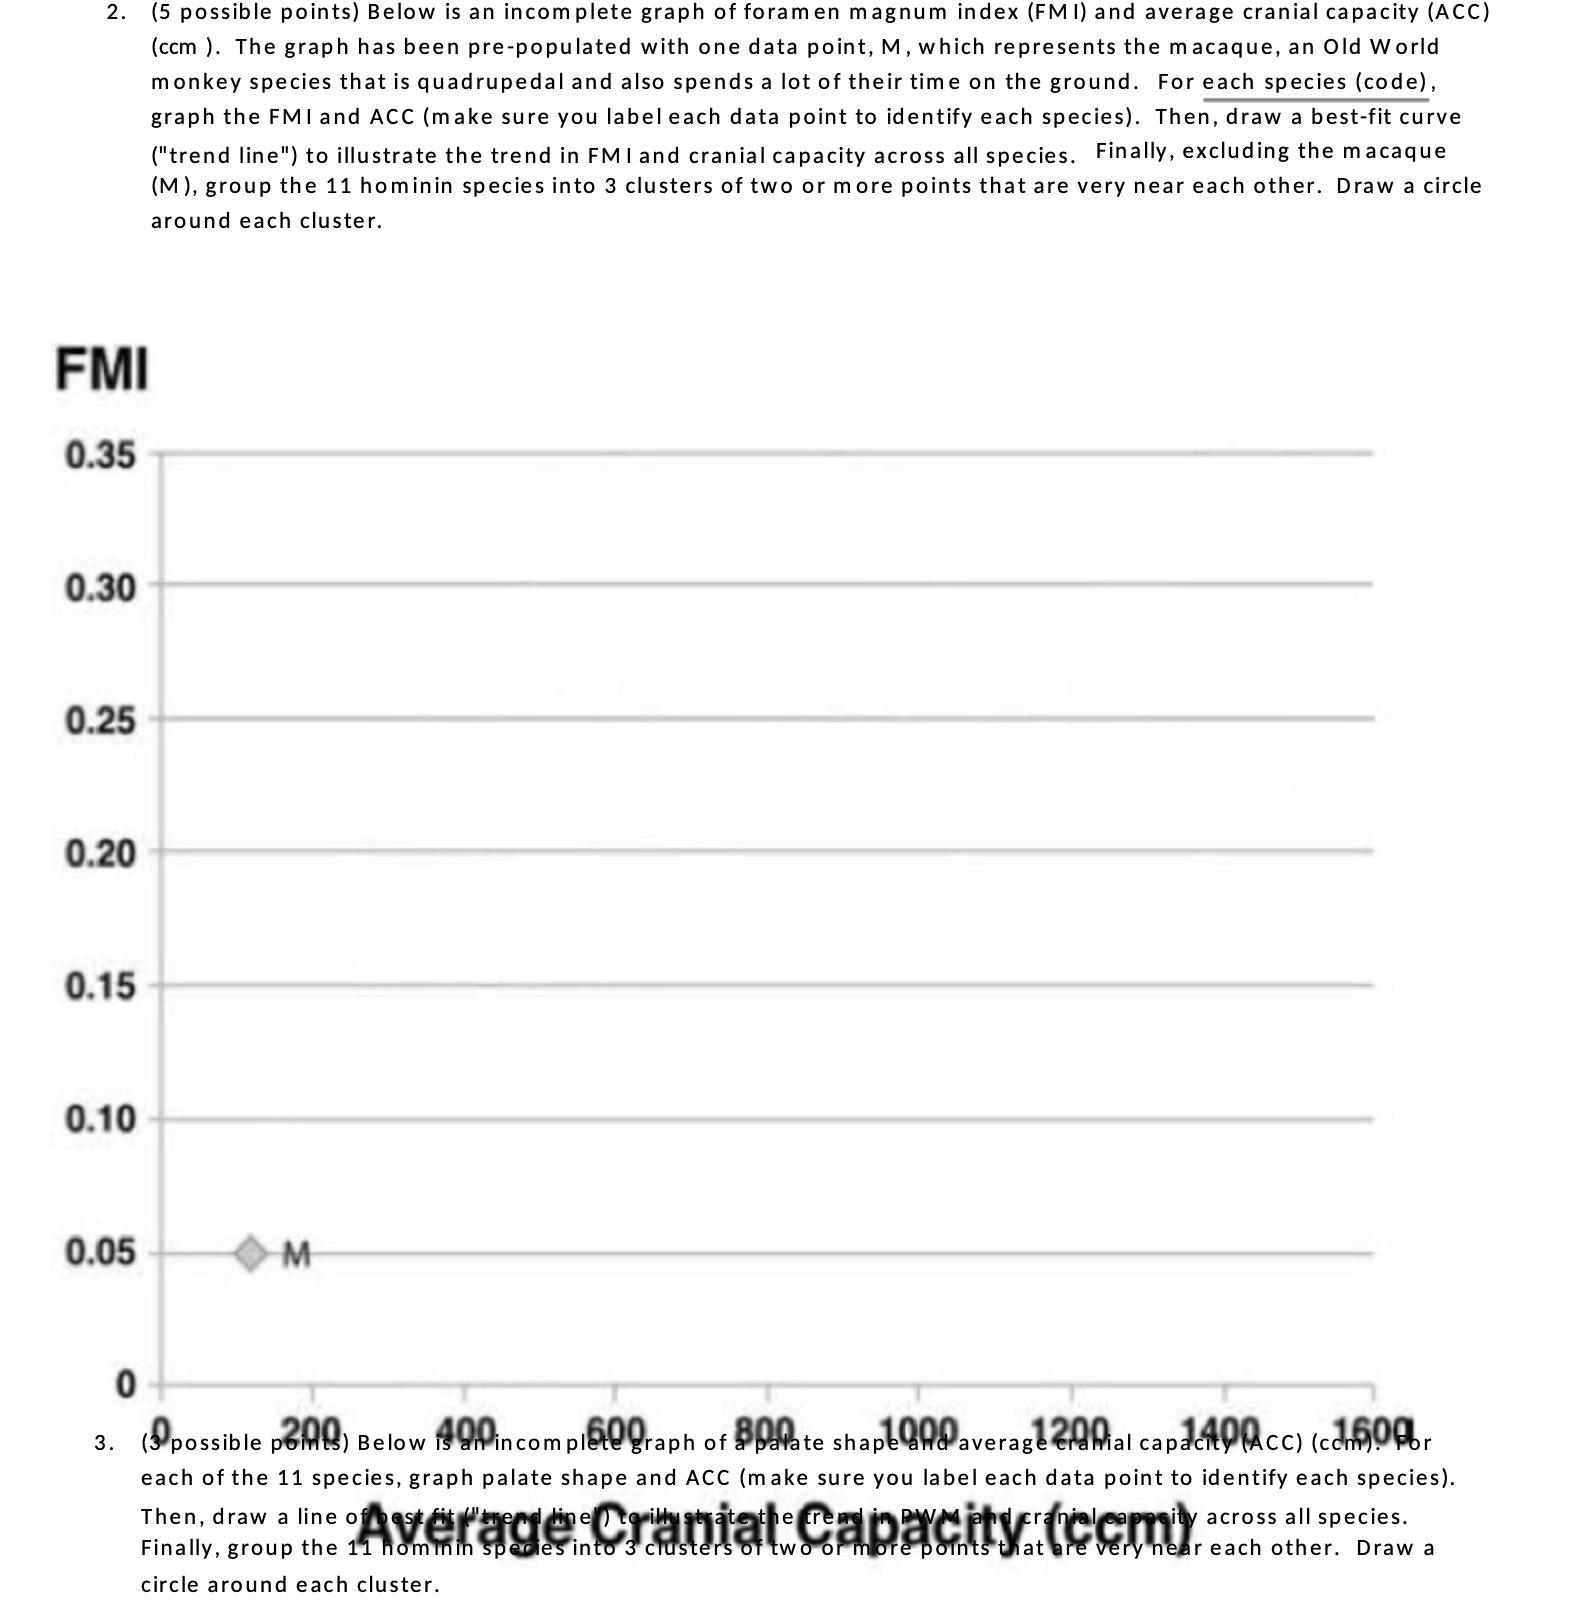
2. (5 possible points) Below is an incomplete graph of foramen magnum index (FMI) and average cranial capacity (ACC) (ccm). The graph has been pre-populated with one data point, M, which represents the macaque, an Old World monkey species that is quadrupedal and also spends a lot of their time on the ground. For each species (code), graph the FMI and ACC (make sure you label each data point to identify each species). Then, draw a best-fit curve ("trend line") to illustrate the trend in FMI and cranial capacity across all species. Finally, excluding the macaque (M), group the 11 hominin species into 3 clusters of two or more points that are very near each other. Draw a circle around each cluster. FMI 0.35 0.30 0.25 0.20 0.15 0.10 0.05 0 3. M (possible pen) Below incomplegraph of palate shape and average al capac0cc) (cr 800 160g Then, draw a line Average Cranial Capacity (ccm) each of the 11 species, graph palate shape and ACC (make sure you label each data point to identify each species). capacity across all species. Finally, group the 11 hominin species into 3 clusters of two or more points that are very near each other. Draw a circle around each cluster.
Step by Step Solution
3.46 Rating (146 Votes )
There are 3 Steps involved in it
2 FMI vs ACC 1 Plot the prepopulated data point M on the graph at FMI 025 ACC 500 ccm representing t... View full answer

Get step-by-step solutions from verified subject matter experts