

Question: 2. A box-and-whisker plot divides the data into four quarters. The boundaries of these segments are called quartiles. The first quartile (Q ) is greater
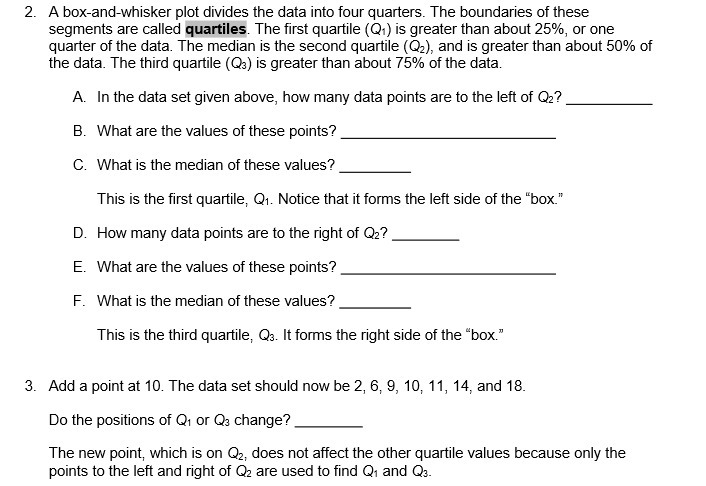
2. A box-and-whisker plot divides the data into four quarters. The boundaries of these segments are called quartiles. The first quartile (Q ) is greater than about 25%, or one quarter of the data. The median is the second quartile (Q2), and is greater than about 50% of the data. The third quartile (Q3) is greater than about 75% of the data. A. In the data set given above, how many data points are to the left of Q2? B. What are the values of these points? C. What is the median of these values? This is the first quartile, Q1. Notice that it forms the left side of the "box." D. How many data points are to the right of Q2? E. What are the values of these points? F. What is the median of these values? This is the third quartile, Q3. It forms the right side of the "box." 3. Add a point at 10. The data set should now be 2, 6, 9, 10, 11, 14, and 18. Do the positions of Q1 or Q: change? The new point, which is on Q2, does not affect the other quartile values because only the points to the left and right of Q2 are used to find Q, and Q3
Step by Step Solution
There are 3 Steps involved in it

Get step-by-step solutions from verified subject matter experts