

Question: Instructions for valuation models: - Valuation based on a publicly traded comparable company analysis - Valuation based on a comparable precedent transaction analysis - Valuation
Instructions for valuation models: - Valuation based on a publicly traded comparable company analysis - Valuation based on a comparable precedent transaction analysis - Valuation based on a discounted cash flow analysis (please show exactly how you calculated the WACC) - 2009E accretion/dilution analysis please make all drivers blue font (black font for the formulas)
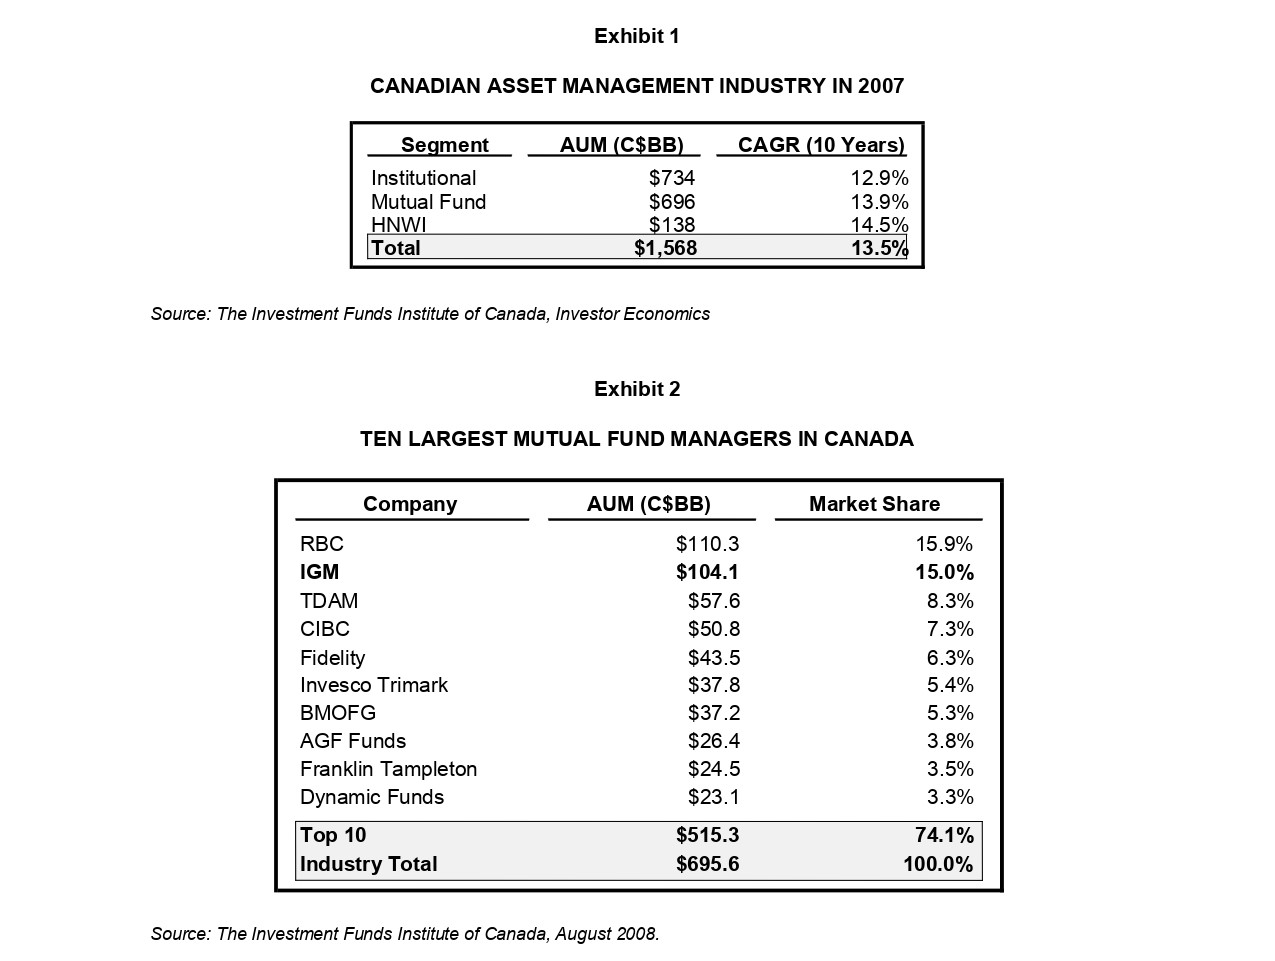
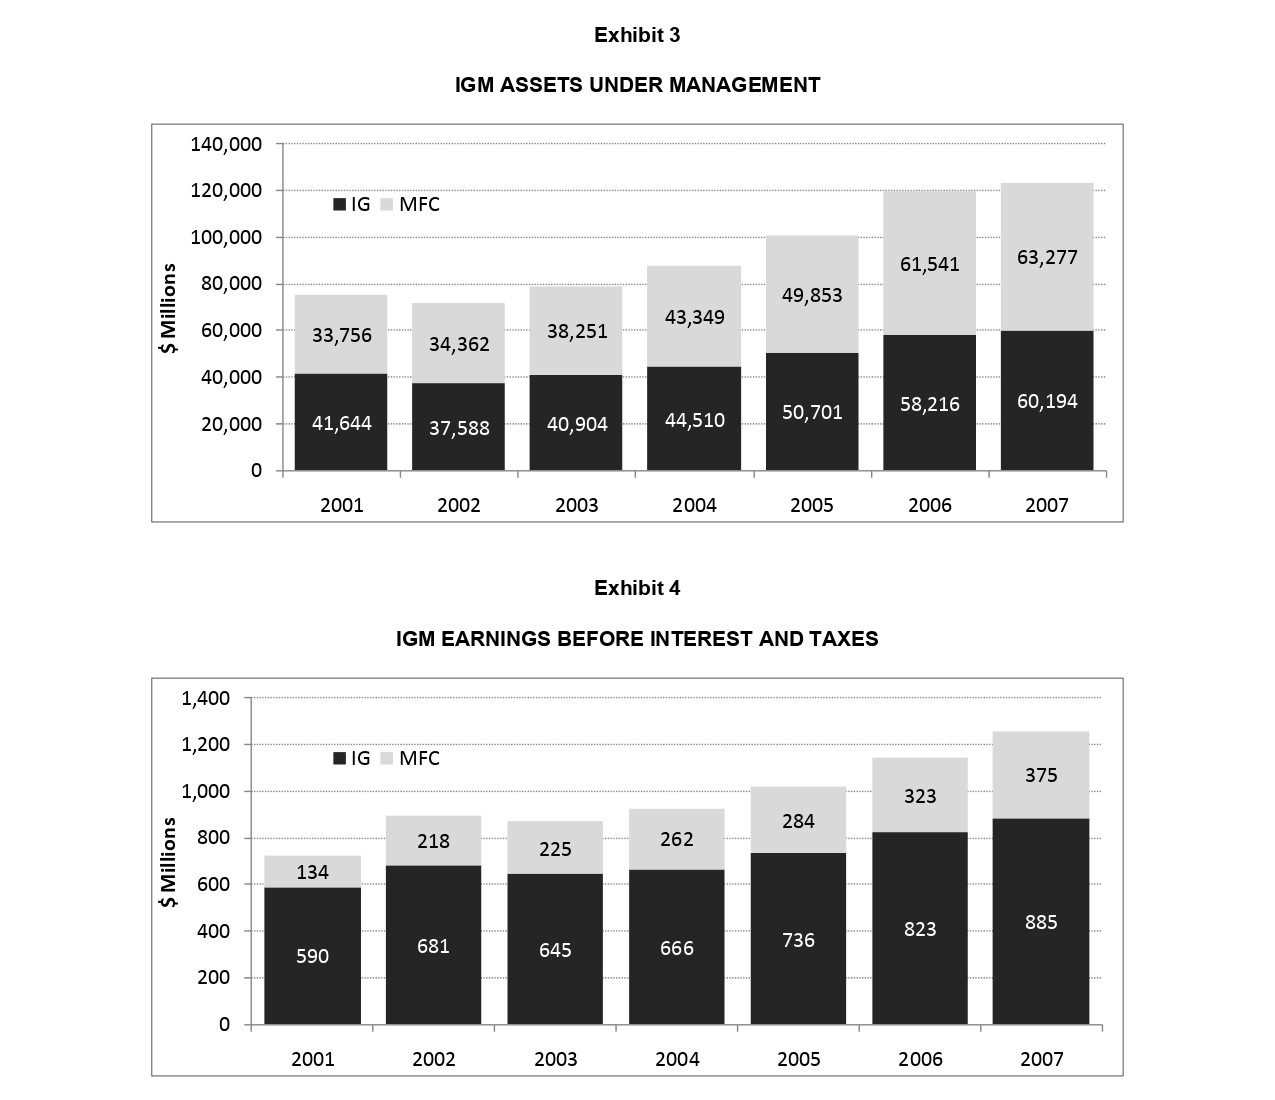
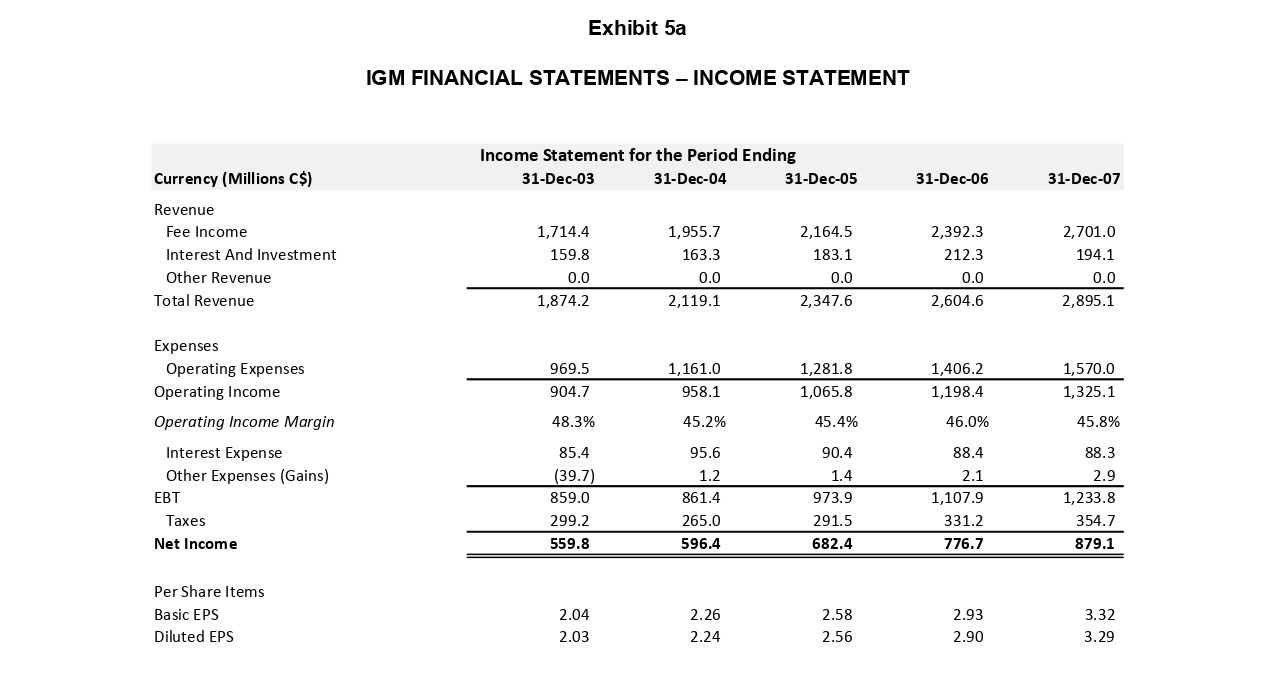
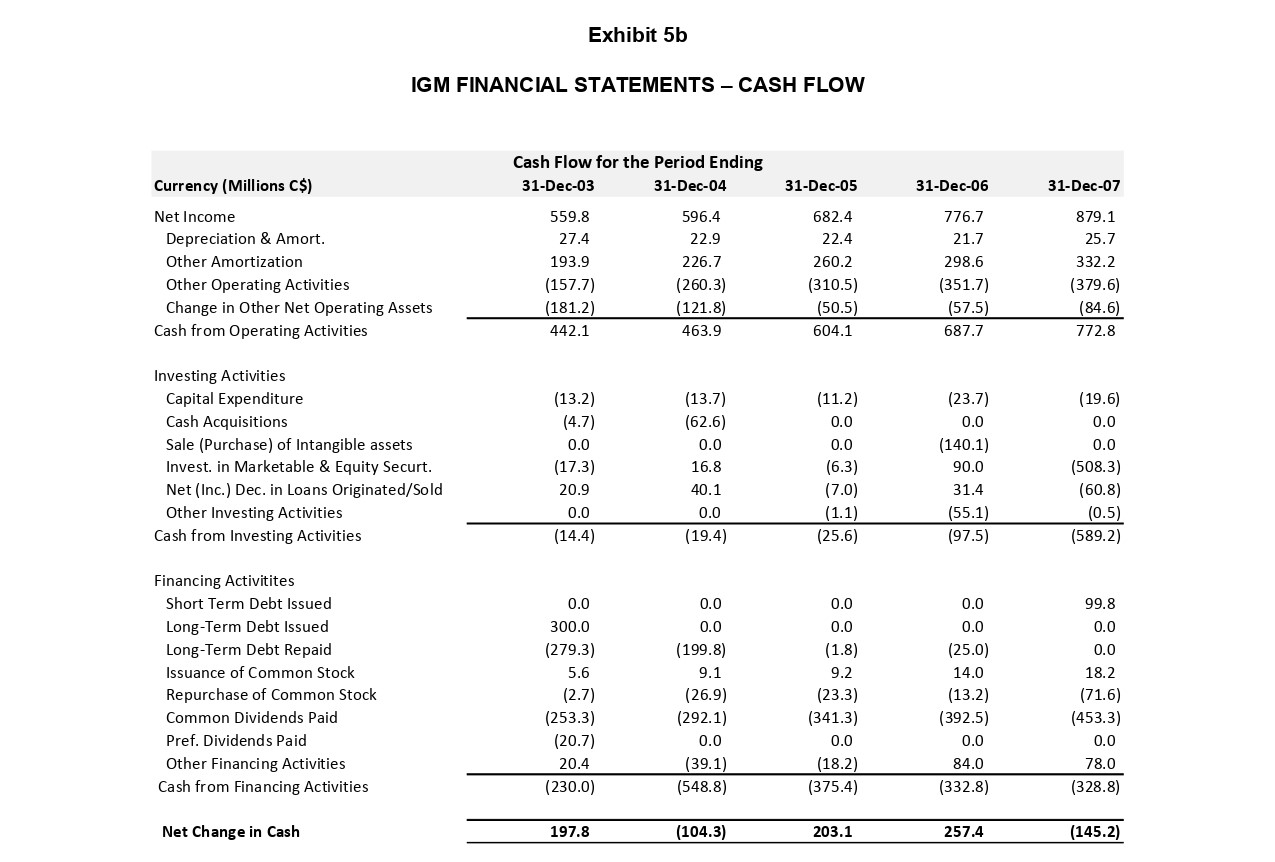
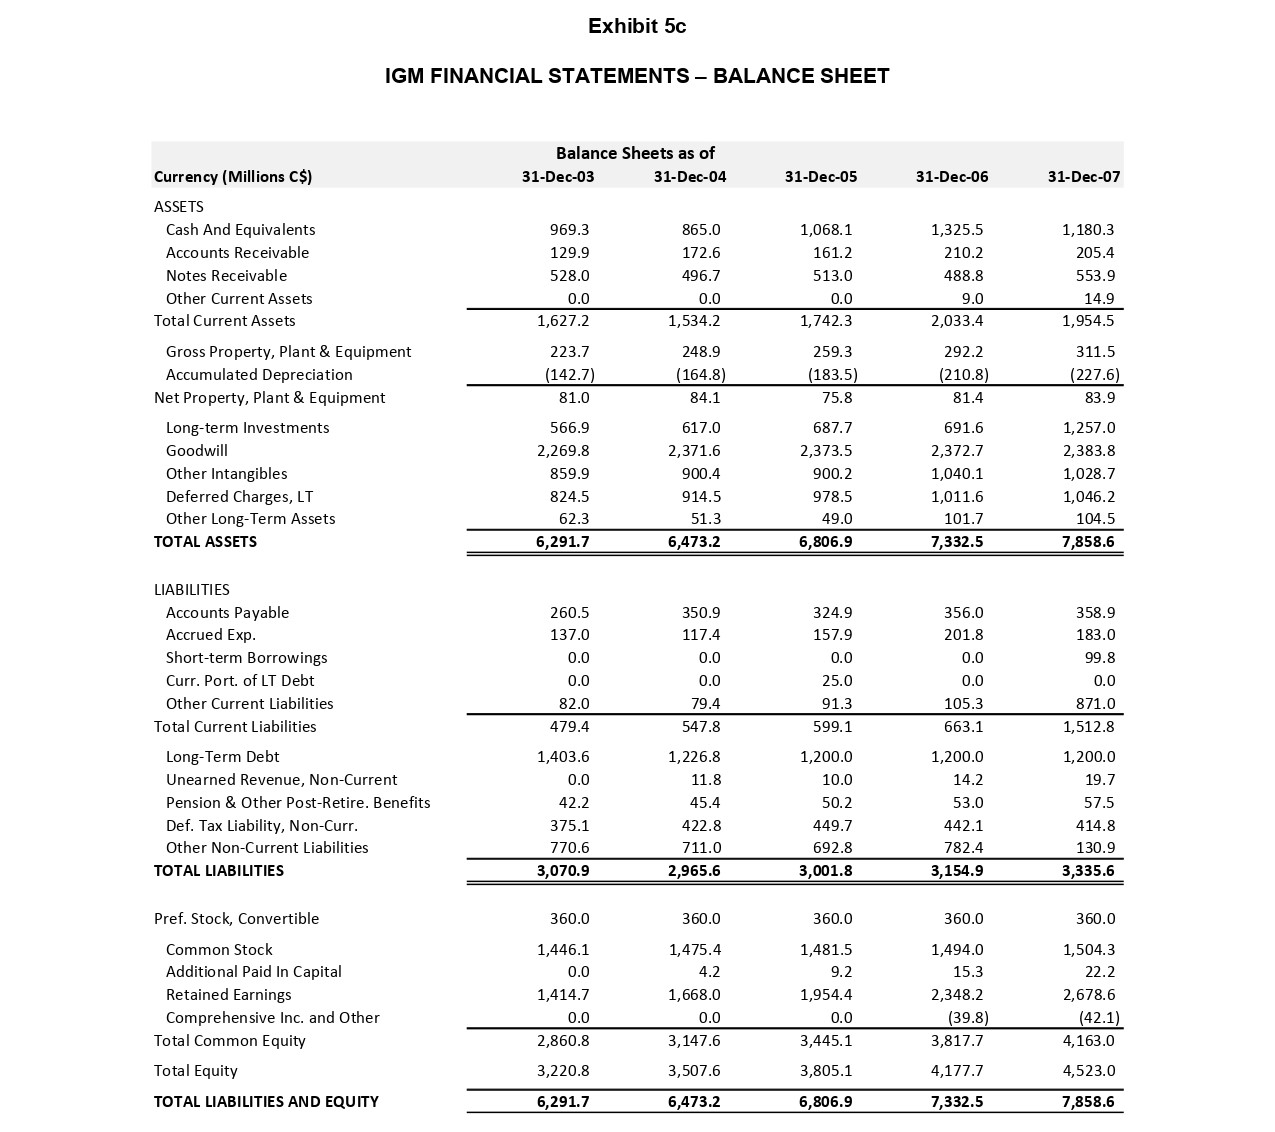
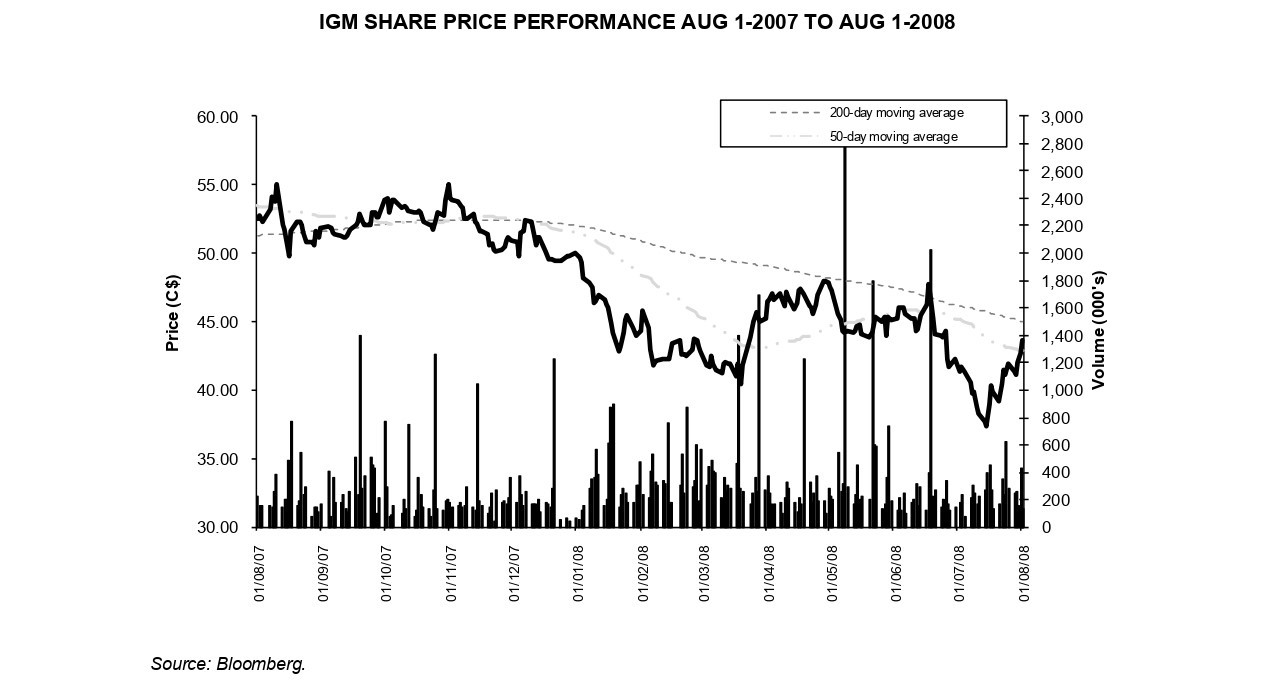
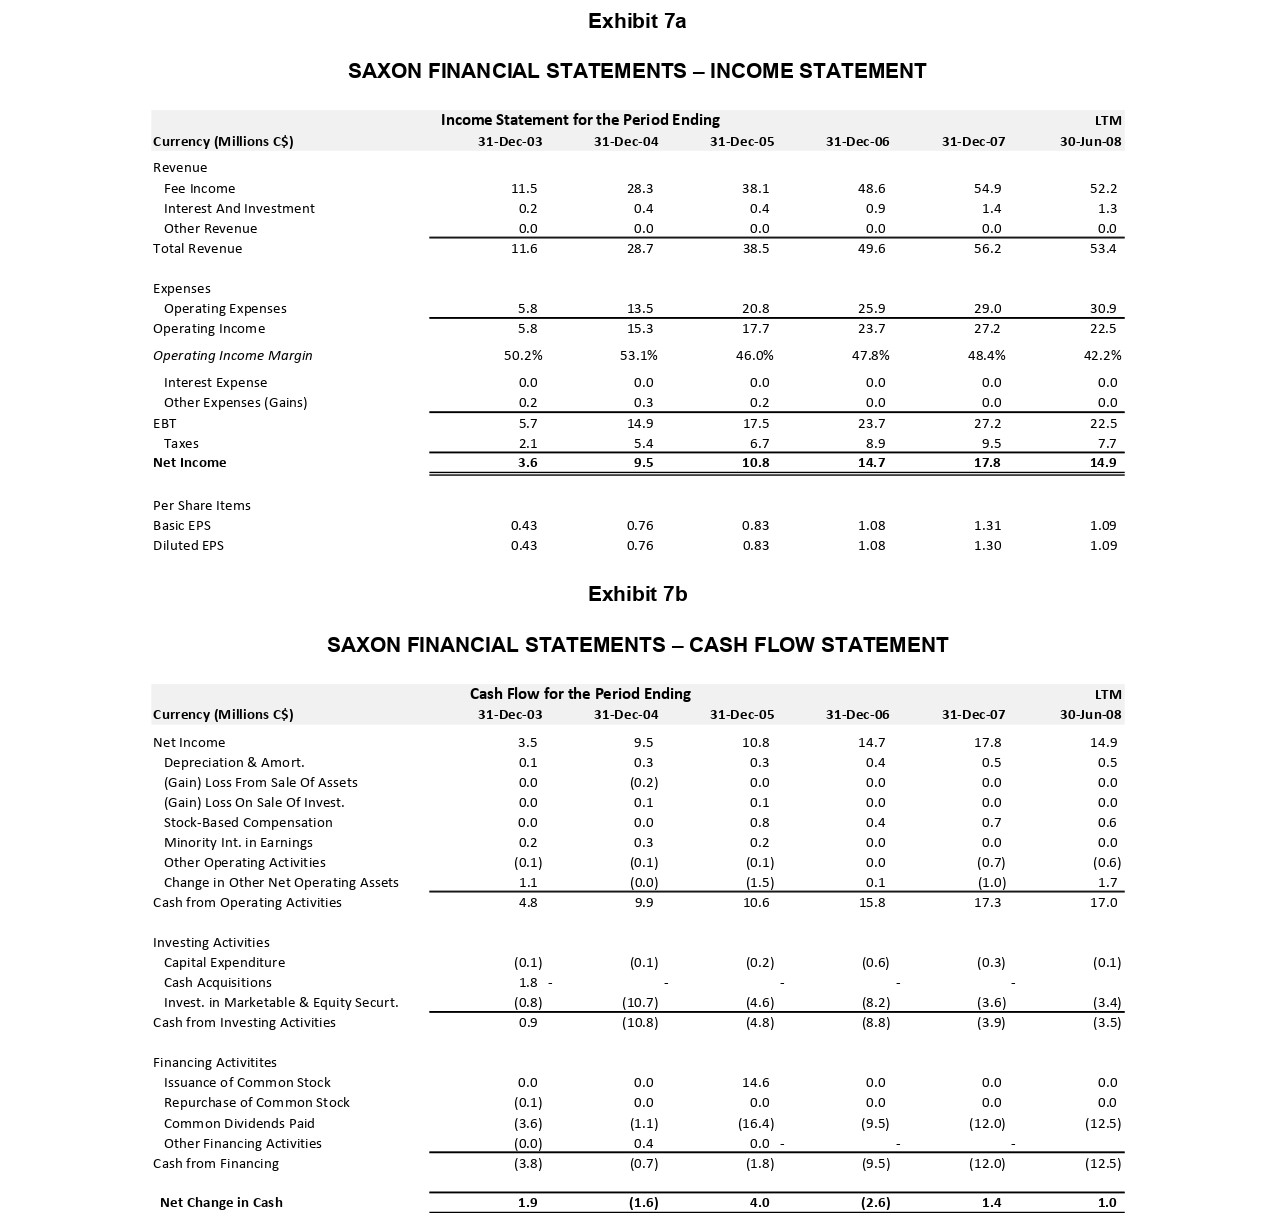
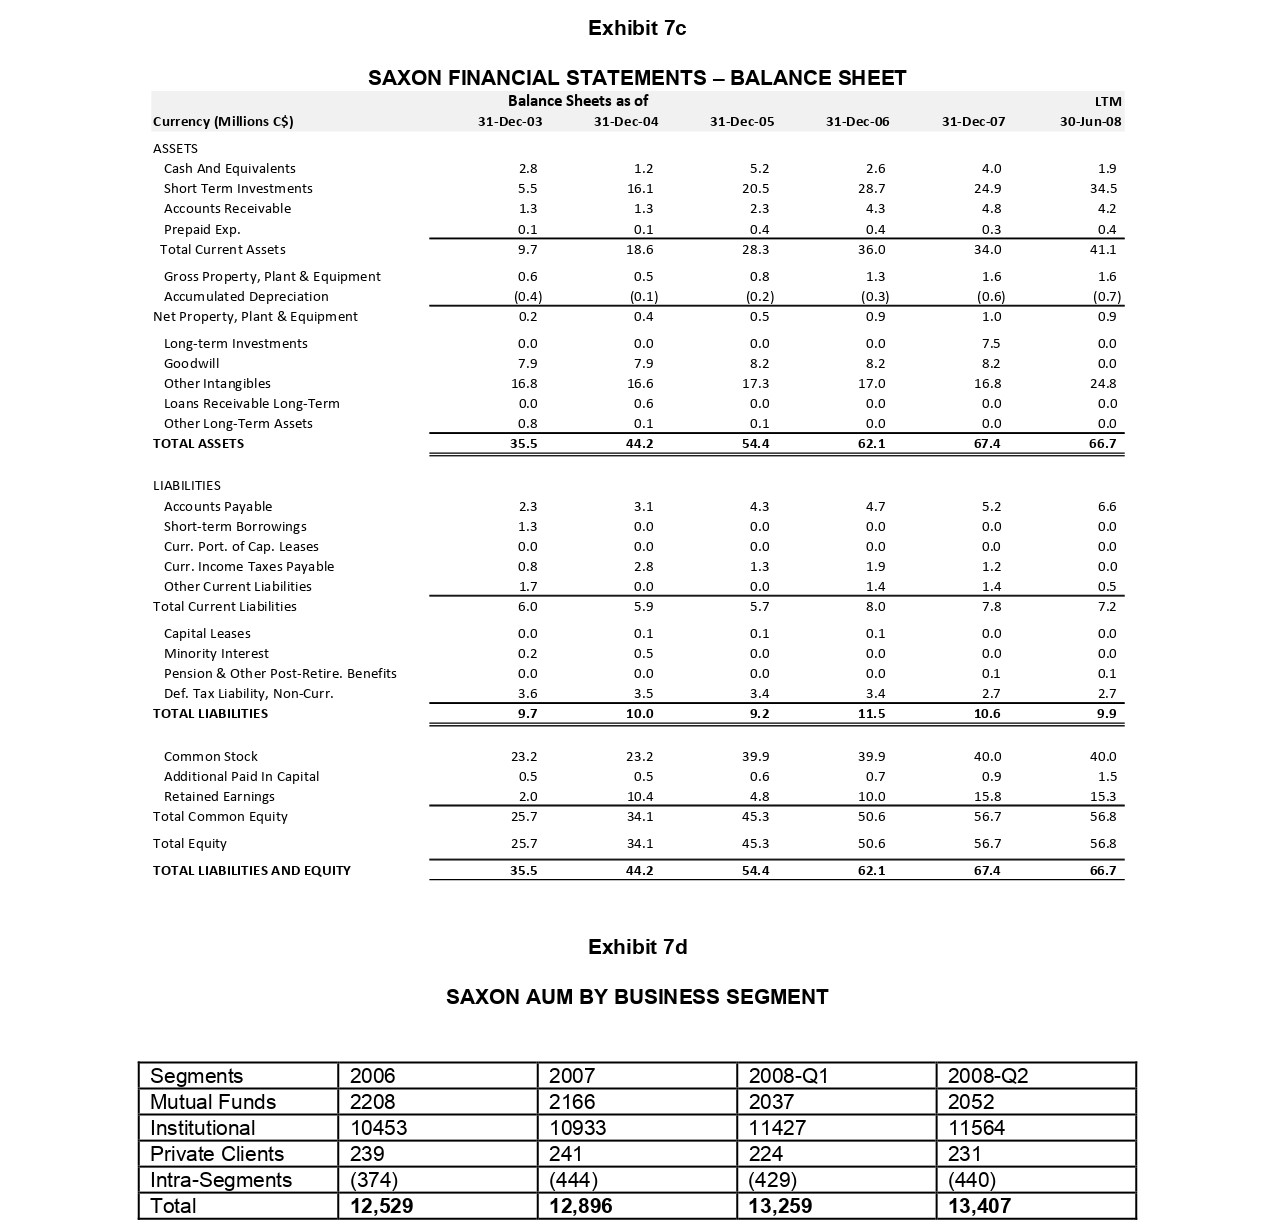
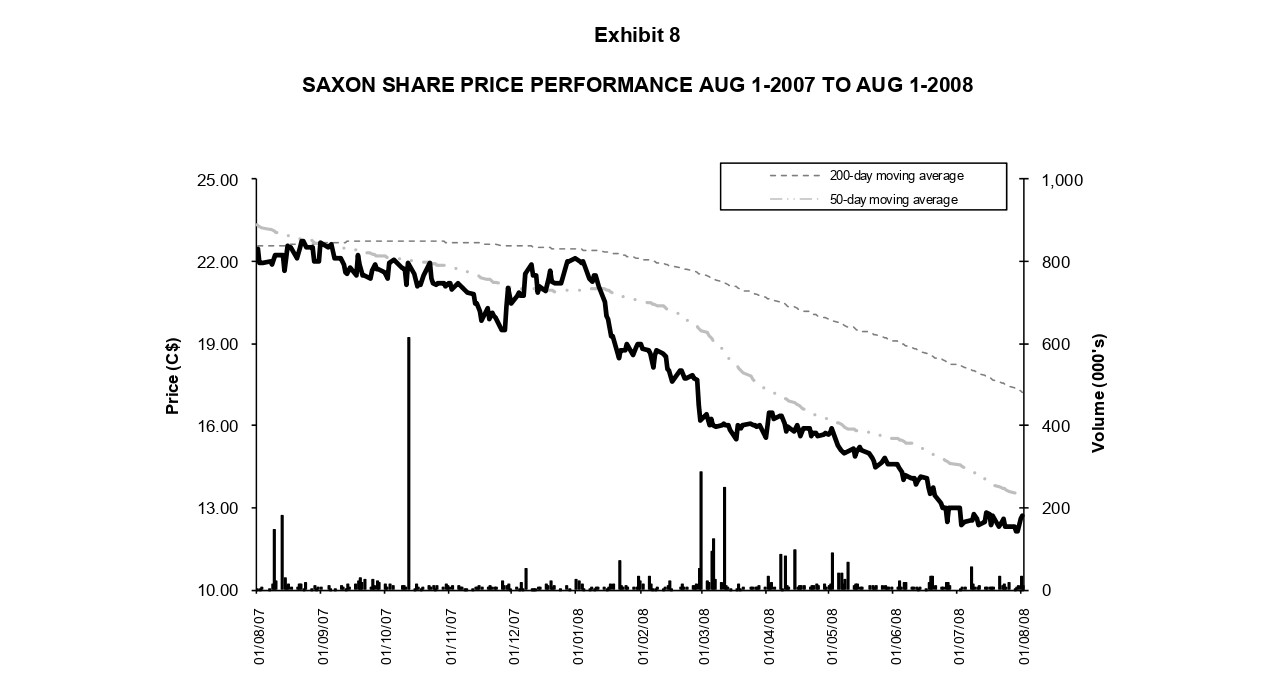
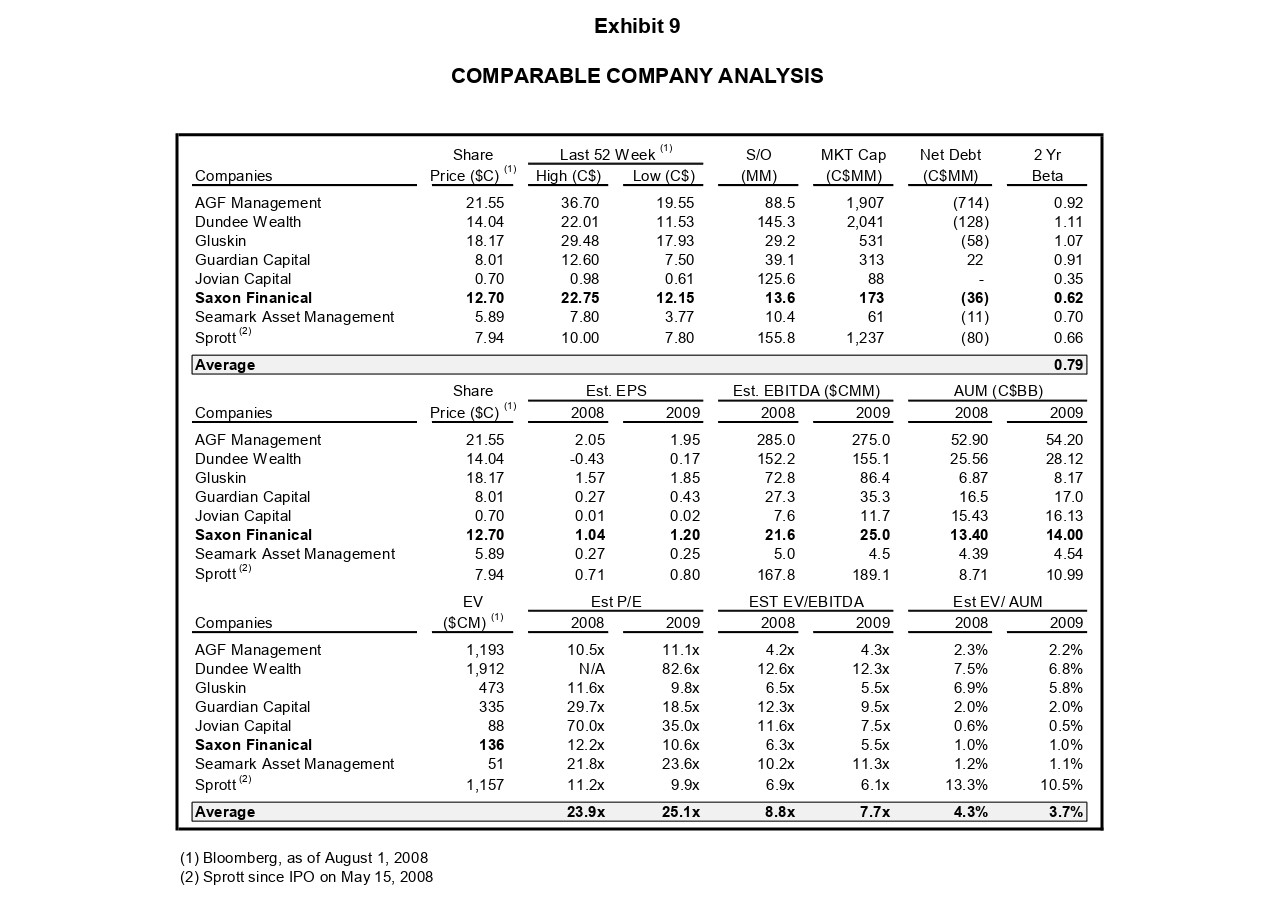
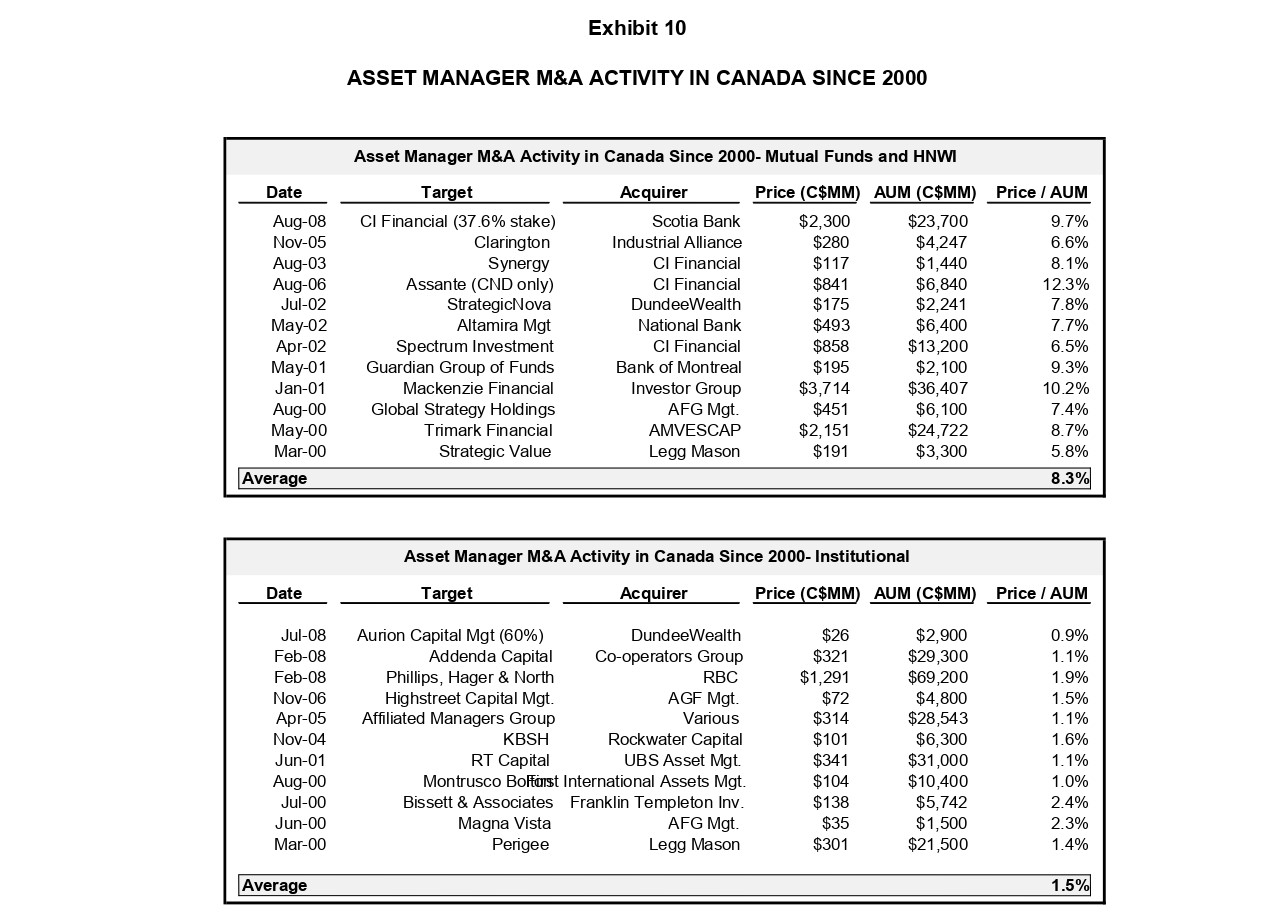
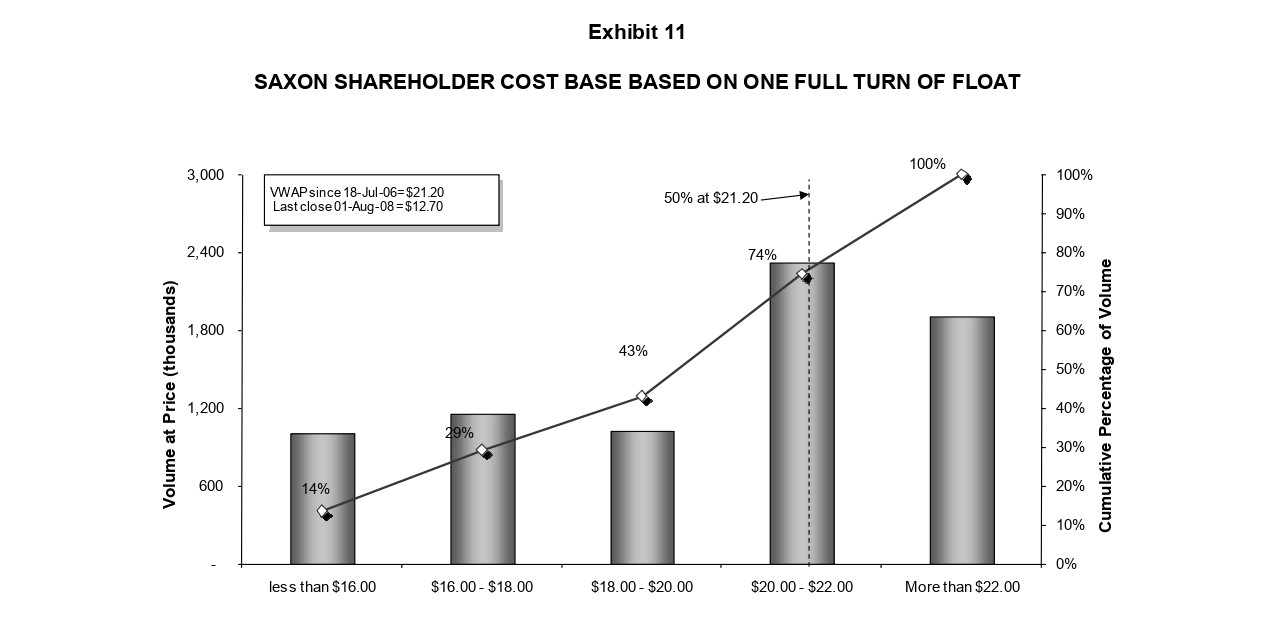
Exhibit 9 (1) vivurinuiy, as ur nuyuar i, suvu (2) Sprott since IPO on May 15, 2008 Exhibit 10 ASSET MANAGER M\&A ACTIVITY IN CANADA SINCE 2000 Saxon Financial Inc. Saxon was an investment management firm that was engaged in all three segments of the asset management industry: mutual funds, institutional asset management and private clients. Saxon's total assets under management were approximately $13.4 billion as at June 30,2008 , of which most were institutional assets. Saxon represented a prime example of the Group 3 asset management firm category, as defined above. Due to its relatively small size, Saxon was not ranked in the top 25 firms for any of the asset classes. When Saxon went public in 2005, it was essentially a secondary offering from its three largest shareholders, with CMA Holdings being the largest one. The Canadian Medical Association (CMA) is a voluntary organization working on behalf of a majority of doctors in Canada. CMA Holdings remained the largest shareholder of Saxon. Saxon's Mutual Funds Saxon offered low-fee mutual funds currently held by approximately 55,000 unit holders. These mutual funds had grown to approximately $2.1 billion in AUM as at June 30,2008, representing approximately 14 per cent of Saxon's total AUM. Saxon distributed its mutual funds through four main distribution channels: the full service advisor channel, comprised of independent financial advisors and brokers; discount brokerages; the direct channel, through a customer call centre; and the proprietary sales force of MD Management Limited (MD Management), a wholly owned subsidiary of CMA Holdings. Saxon's Institutional Asset Management Saxon managed approximately $11.6 billion in institutional assets at June 30, 2008. These assets comprised $2.4 billion in third-party mutual funds, pension plans and foundations, and approximately $9.2 billion in assets under a variety of mandates for CMA Holdings and CMA. Institutional assets accounted for approximately 84 per cent of Saxon's total AUM at June 30, 2008. Saxon had secured a prominent asset management profile within CMA Holdings through fixed income and equity mandates and through the distribution of Saxon Mutual Funds to CMA Holdings' clients. CMA Holdings represented Saxon's largest institutional client, with approximately $9.2 billion in assets currently managed pursuant to a variety of mandates. MD Management, a subsidiary of CMA Holdings, represented a significant thirdparty distribution channel for Saxon Mutual Funds. The relationship with CMA was often cited by research analysts as a key strength of Saxon as it enabled Saxon to provide mutual funds to all doctors in Canada, a group with very high disposable incomes and a very high propensity to invest. Saxon's Private Clients Saxon's also had a very small division that provided discretionary investment management to high net worth individuals. Total AUM at June 30, 2008, was insignificant at around $230 million, representing approximately two per cent of Saxon's total AUM. Exhibit 7a SAXON FINANCIAL STATEMENTS - INCOME STATEMENT Exhibit 7b SAXON FINANCIAL STATEMENTS - CASH FLOW STATEMENT chance of success as most shareholders would feel like they were "losing" on their investment. The ACB was $15.54 over the past six months and $16.50 over the past 12 months. On the other hand, the company knew that one of the primary reasons that acquisitions had historically failed to deliver long-term value for the buyer was because most acquirers were deemed to overpay. There was clearly a trade-off between coming up with an attractive initial bid, which would lock up enough shareholders to close the deal without any delays, proxy fights or poison pills, versus avoiding overpaying and ending up with a negative EPS accretion (i.e. a decrease in the earnings per share of the acquiring company) for the purchase. Financing the Acquisition IGM was considering paying for the acquisition using cash or through the issue of IGM common shares to the owners of Saxon. By issuing new shares, IGM risked decreasing the earnings per share of IGM, a result that would not be looked on favourably by the investment community. Thus one of the considerations was to ensure that the transaction would be accretive (or at least would not result in negative accretion) to earnings per share of IGM. The Decisions With fewer than three days left until the offer was to be made, many questions still remained to be answered. Did the acquisition of Saxon make strategic sense? Should IGM wait for the equity market to calm down before making the bid? What price should it pay, and would the transaction be accretive to IGM earnings per share? Exhibit 5b IGM FINANCIAL STATEMENTS - CASH FLOW Exhibit 5c IGM FINANCIAL STATEMENTS - BALANCE SHEET Saxon's Investment Returns and Financial Performance Saxon derived its revenue primarily from management fees charged to their mutual fund, institutional and private clients. Management fees were calculated as a percentage of the market value of AUM and, consequently, management fees fluctuated as the market value of AUM changed (see Exhibit 7). Operating expenses included expenses that were directly related to the level of AUM, such as trailer commissions, 4 investment sub-advisory fees 5 and custody expenses, and general and administrative expenses associated with Saxon's operations. Despite relatively weak investment returns in the past year (only 37 per cent of the company's mutual funds were in the first or second quartile over the past year), Saxon still had a strong reputation as a successful asset manager. Despite strong AUM growth, significant increase in EPS, a captive customer base (Canadian doctors) and a reputation as good "stock pickers," Saxon's share price performance had been poor (see Exhibit 8). Short-Term Goals It was rumoured that in late December 2007, Saxon's board of directors had established a special committee composed of the company chairman and key shareholders. The committee's purpose was to identify and consider any strategic alternatives that could potentially maximize shareholder value. Valuation of Saxon A key issue facing IGM was to determine what valuation method (including discounted cash flow, precedent transactions and trading comparables) would produce the most accurate and fair value for Saxon. If these methods provided widely different values, how should they be reconciled? Discounted Cash Flow (DCF) Historical financial statements for Saxon (see Exhibit 7), analysts' publicly disclosed projections for the next two years for the peer group (see Exhibit 9) and data obtained privately from buy-side analysts showed that analysts were expecting key financial metrics to perform as follows: - Significant decrease in revenue by 10 per cent in 2008 (due to difficult equity markets) followed by a sharp increase of 16 per cent in 2009. Starting in 2010, yearly revenues could increase by six per cent, five per cent and four per cent respectively, after which a terminal value should be applied. - EBITDA margin would recover to a 45 per cent level. - Taxes would remain steady at 34.5 per cent. - Terminal Value - most analysts assumed four per cent growth rates starting in 2013. - Synergies - back-office operations at Saxon currently amounted to about $10 million per year. Research analysts expected that about $5 million annually could be saved in case of any mergers and acquisitions (M\&A) transaction. Exhibit 5a IGM FINANCIAL STATEMENTS - INCOME STATEMENT Exhibit 11 SAXON SHAREHOLDER COST BASE BASED ON ONE FULL TURN OF FLOAT In August 2008, IGM Financial was working on the final details regarding the proposed acquisition of Saxon Financial Inc. (Saxon). In preparation for a public offer for all the outstanding shares of Saxon, the company wanted to review the strategic rationale, the proposed transaction value and the impact of the acquisition on IGM. THE FINANCIAL ASSET MANAGEMENT INDUSTRY Both Saxon and IGM operated within the Canadian asset management industry, which consisted of three principal segments: mutual funds, institutional asset management and private clients who were labelled as high net worth individuals (HNWI) (see Exhibit 1). The industry as a whole had experienced tremendous growth, with mutual fund assets alone increasing from \$3.6 billion in 1980 to \$696 billion in 2007. Asset management firms could be broadly grouped into three main categories, based on the type of the clients they served: - Group 1 consisted of large pension funds such as the Canada Pension Plan, Caisse de Depot et Placement du Quebec, or Ontario Teachers' Pension Plan. This group managed money on behalf of millions of Canadians by investing the assets (i.e. pension contributions) directly into equity, debt or private market or, in some cases, "funds of funds" managed by other financial institutions. - Group 2 was made up of bank-owned subsidiaries such as RBC Asset Management and TD Asset Management, along with mass market mutual fund companies such as AGF Management and IGM. This group offered two main product lines: mutual funds targeted toward small retail investors (essentially the investing public) and products targeted towards large institutional clients such as corporate pension funds, endowment funds and union pension funds (essentially, Group 1 as defined above). These products were commonly referred to as segregated or pooled funds. - Group 3 comprised a large number of small-sized asset managers (private companies and publicly traded firms with small capitalization). Their core product offering was segregated or pooled funds Internal data suggested that the risk-free rate was 3.66 per cent, the market risk premium was 7.42 per cent, the small cap risk premium was 1.74 per cent and Saxon's two-year beta was 0.62 . Most asset managers charged monthly management fees; therefore, cash flows were expected to come in evenly throughout the year. At the earliest, the transaction would close on October 1, 2008. Thus it was appropriate to include only one-quarter of the 2008 cash flows in the DCF calculation. For simplicity, it was assumed that all annual cash flows beyond 2008 would occur at the end of the respective years. Comparables An important aspect of the valuation of Saxon would be the selection of the "right" comparable companies. A list of companies had been provided by investment bankers (see Exhibit 9), but it was challenging to determine which companies were truly comparable. - Sprott - over 52 per cent of its AUM was in mutual funds, and 24 per cent was in hedge funds, both of which provided significantly higher base fees as compared to segregated or pooled funds. Most of Saxon's assets were institutional assets. - Gluskin - a strong track record (outperformed S\&P-TSX in the past 21 of 23 years) enabled the firm to charge exceptionally high performance fees. Most of its assets (about 90 per cent) were managed for HNWI, which attracted higher base fees plus performance fees. - AGF and Dundee - both much larger in size and with a primary focus on mutual funds. - Guardian Capital - similar market capitalization and AUM size to Saxon. AUM split was about twothirds institution and one-third retail market. - Jovian Capital - similar market capitalization and AUM size to Saxon. - Seamark Asset Management - smaller in size but very similar in focus; over 60 per cent of AUM in institution funds. Precedent Transactions Another method of valuing an acquisition was to look at other transactions that were viewed as comparables to the one being contemplated. The company had data on precedent transactions going back to 2000 (see Exhibit 10), grouped by asset class. Average Cost Base Since Saxon's share prices had been declining over the past year and a premium bid to the last closing price may not look very attractive to existing shareholders, it was important to determine the average price at which Saxon's shareholders had originally purchased their shares. This was called the average cost base (ACB). Calculating the ACB was imprecise but could be an important factor in any M\&A deal. Estimated float (total shares outstanding less shares owned by the two founders and CDA) was estimated to be around 7.4 million shares, and, based on historical trading volumes, it was determined that it took just over two years 6 for full turnover of float to occur with a corresponding average price of about $21.20 (see Exhibit 11). Investment bankers explained to the company that a bid below $21.20 would have little Exhibit 3 IGM ASSETS UNDER MANAGEMENT Exhibit 4 IGM EARNINGS BEFORE INTEREST AND TAXES SAXON SHARE PRICE PERFORMANCE AUG 1-2007 TO AUG 1-2008 IGM SHARE PRICE PERFORMANCE AUG 1-2007 TO AUG 1-2008 Source: Bloomberg. Exhibit 7c Exhibit 7d SAXON AUM BY BUSINESS SEGMENT Exhibit 1 CANADIAN ASSET MANAGEMENT INDUSTRY IN 2007 Source: The Investment Funds Institute of Canada, Investor Economics Exhibit 2 TEN LARGEST MUTUAL FUND MANAGERS IN CANADA Source: The Investment Funds Institute of Canada, August 2008. MFC generated revenue primarily through management fees (about 81 per cent of total fees earned in 2007) charged to mutual funds, as well as through sub-advised 3 and institutional accounts. Mutual funds comprised over 70 per cent of total AUM. MFC also earned fees for administrative and other services. Similar to Investor Group, the key earnings driver was the value of AUM. IGM Investment Returns and Financial Performance Most analysts rated IGM a buy' (as were companies such as Merrill Lynch, General Electric, Bear Stern, Toyota Motors and Lehman Brothers), with a target price based on very strong historical financial performance that was far above current trading levels. Earnings per share (EPS) had increased from $2.04 in 2003 to $3.32 in 2007 (see Exhibits 5a, 5b and 5c). IGM led the entire universe of asset managers in operating margin. The company's 45 per cent operating margin level for 2007 easily surpassed the 30 per cent to 33 per cent average for the group. This was likely due to Investor Group's exclusive distribution system and to IGM's scale benefits in Canada. However, the stock had been under pressure for the past 12 months (see Exhibit 6). This was due to: - Subpar investment returns - lower net inflows into its mutual funds were occurring due to IGM's lower relative performance, which was hurting new sales. Only about 30 per cent of its funds were in the first or second quartile versus 88 per cent for its nearest competitors such as RBC Asset Management. - Global equities market turmoil - total Canadian mutual fund AUM in August 2008 of $696 billion was down two per cent from its high in May 2007, and AUM growth had fallen in four of the past five quarters. - Weak organic growth - despite its No. 2 ranking in mutual fund AUM, IGM's average organic growth (growth of assets before net sales) trailed its Canadian peers, placing it ninth out of the top 10. The issue was predominantly in the MFC division, which had posted four straight quarters of negative organic growth. Outlook and Short-Term Goals To deal with the above-mentioned challenges, IGM's management indicated it was actively looking to expand the company's presence in the institutional sector to further take advantage of existing economies of scale. Management was also looking to expand into the HNWI sector to capture the projected aboveaverage growth rates of AUM within the HNWI segment, possibly through a merger or acquisition transaction. Based on analyst consensus for 2009, IGM was expected to earn about $927 million, which would result in EPS of $3.49 based on 265.75 million shares outstanding. Given the current share price of $43.60, this resulted in a 2009 estimated price to earnings (P/E) ratio of 12.5 times, which was 15 per cent below IGM's five-year historical ratio of 14.6x and below the Canadian asset manager index forward P/E of 15.0x. On a relative basis, IGM was viewed as an attractive buy by the analysts, but perhaps the lower P/E ratio was fully justified, given its recent performance, and analysts were simply too optimistic about IGM's longterm growth potential targeted at smaller institutional clients and, in some cases (Saxon being one of them), mutual funds were offered as well. HNWI were serviced by Groups 2 and 3. The business model (i.e. how asset managers made money) could be captured by a few key concepts. The key earnings driver was the level of assets under management (AUM). AUM was, in turn, driven by three factors: - Gross Sales - sales of financial products to new investors or in-kind transfer-in from other financial institutions; - Redemptions - cash withdrawals or in-kind transfer-out to other financial institutions; and - Net Asset Value - primarily driven by overall equity market conditions. Essentially, firms had to successfully gather and maintain financial assets on which they could charge management fees which ranged from 0.50 per cent of AUM for institutional money to 2.25 per cent for mutual funds. At the same time, firms had to manage operating expenses. Most of the operating costs were directly related to the level of AUM and hence to revenue. With salaries, bonuses and commissions tied to size and performance of funds, the key to high EBITDA amount and stable EBITDA margin was, therefore, the ability to maintain a similar product mix and keep commission payouts stable while growing the size of AUM. The four key success factors were: - Increased demand by savers - based on underlying demographics, the demand for savings vehicles had been steadily increasing. These new inflows averaged about three per cent to four per cent of total assets already invested. Since net switching by savers from one fund to another was modest, new inflows represented the greatest opportunity for the growth of new firms relative to existing players. - Equity and debt market performance - the value of AUM was highly sensitive to the performance of the financial markets. As the value of equities grew over time, there was a natural increase in AUM. This growth due to recent strong markets accounted for a far greater increase in AUM than did new sales. - Individual firm performance - most asset managers tried (and often failed in the long run) to consistently earn above-market returns. There was a tendency for investors to invest new funds and retain existing funds with asset managers that ranked within the top two quartiles of market performance. - Product innovation - the overwhelming majority of academic studies had demonstrated that most financial innovations in the asset management industry did not increase the upside potential for investors, but products such as Manulife's IncomePlus provided significant benefit to investors in the form of downside protection in the Retirement Risk Zone. 2 Such innovations contributed greatly to increase margins and market share for the firms that designed and marketed them. Such innovation had accelerated since the mid-1990s. IGM IGM was a large, publicly traded, asset management company that was a part of the large Canadian financial conglomerate. Its parent company directly owned 56 per cent of IGM and 70 per cent of a large Canadian insurance firm. The company operated primarily through its two wholly owned divisions, Investors Group and Mackenzie Financial Corporation, which comprised roughly 68 per cent and 28 per 2 "Retirement Risk Zone" - This was defined as the five to 10 years before and after investors reach retirement, i.e., when their portfolios are most vulnerable to market downturns and volatility. IncomePlus provided guaranteed monthly payments independent of when an investor retired in the market cycle, as well as growth potential, flexibility and control. cent of earnings, respectively. IGM was Canada's second-largest mutual fund asset manager (see Exhibit 2 ), with a 15 per cent market share and over $104 billion in mutual fund assets under management. Mutual funds made up approximately 90 per cent of IGM's total AUM. IGM represented a prime example of a Group 2 asset management firm, as defined above. Investors Group Investors Group comprised roughly 57 per cent of IGM's revenue and 68 per cent of its earnings before interest and taxes (EBIT). Investors Group provided financial planning advice and services - including investment, retirement, estate and tax planning - through a network of more than 4,300 exclusive consultants (i.e. working only for IGM) by offering an extensive array of Investors Group managed mutual and money market funds, mortgage products, and insurance and banking products from various third-party companies. - Brokerage Division - Clients could open accounts such as registered retirement savings plans (RRSPs), registered retirement income funds (RRIFs) and registered education savings plans (RESPs) and purchase securities such as bonds, debentures, stocks, treasury bills, guaranteed investment certificates (GICs), and commercial paper on top of the wide variety of mutual and money market funds offered. - Investment Division - As Canada's largest mutual fund company, Investors Group had the resources and expertise to deliver a complete line of mutual funds and money market funds. - Mortgage Division - As a residential mortgage lender, Investors Group offered a multitude of both fixed and variable rate mortgage products. Investors Group consultants were teamed up with a mortgage planning specialist to simplify the complex mortgage process and ensure that their mortgage was an integral part of client's overall financial plan. - Insurance Division - Investors Group's consultants were able to offer a full suite of life insurance and living benefits products through their partners such as Canada Life, Great-West Life, Manulife and Sun Life. Also available was a complete product package that spanned term life insurance, permanent participating life, universal life, disability, critical illness, long-term care, health and dental insurance. - Banking Division - Investors Group had teamed up with the National Bank of Canada to offer comprehensive banking solutions. Investors Group earned revenue (about 77 per cent of total fees earned in 2007) primarily through management fees charged to its mutual funds. For the last several years, the group had experienced a steady growth in both AUM and EBIT (see Exhibits 3 and 4). The funds were distributed through the company's consultant network, which had grown in numbers for 16 straight quarters to 4,360 members as of the second quarter of 2008. As with other asset managers, the key earnings driver was the level of AUM. Mackenzie Financial Corporation Division The Mackenzie Financial Corporation division (MFC) accounted for approximately 37 per cent of IGM's revenue and 28 per cent of its EBIT. MFC was one of Canada's premier investment managers, providing investment advisory and related services in North America. MFC's core business provided investment advice and services through independent financial advisor channels, (i.e. sold products on behalf of various financial institutions, not just IGM's, as was the case with the Investor Group unit). MFC distributed its investment products and expertise through a sophisticated network of third-party financial advisors. MFC's wholesale teams worked with many of the more than 30,000 independent financial advisors across Canada. Exhibit 9 (1) vivurinuiy, as ur nuyuar i, suvu (2) Sprott since IPO on May 15, 2008 Exhibit 10 ASSET MANAGER M\&A ACTIVITY IN CANADA SINCE 2000 Saxon Financial Inc. Saxon was an investment management firm that was engaged in all three segments of the asset management industry: mutual funds, institutional asset management and private clients. Saxon's total assets under management were approximately $13.4 billion as at June 30,2008 , of which most were institutional assets. Saxon represented a prime example of the Group 3 asset management firm category, as defined above. Due to its relatively small size, Saxon was not ranked in the top 25 firms for any of the asset classes. When Saxon went public in 2005, it was essentially a secondary offering from its three largest shareholders, with CMA Holdings being the largest one. The Canadian Medical Association (CMA) is a voluntary organization working on behalf of a majority of doctors in Canada. CMA Holdings remained the largest shareholder of Saxon. Saxon's Mutual Funds Saxon offered low-fee mutual funds currently held by approximately 55,000 unit holders. These mutual funds had grown to approximately $2.1 billion in AUM as at June 30,2008, representing approximately 14 per cent of Saxon's total AUM. Saxon distributed its mutual funds through four main distribution channels: the full service advisor channel, comprised of independent financial advisors and brokers; discount brokerages; the direct channel, through a customer call centre; and the proprietary sales force of MD Management Limited (MD Management), a wholly owned subsidiary of CMA Holdings. Saxon's Institutional Asset Management Saxon managed approximately $11.6 billion in institutional assets at June 30, 2008. These assets comprised $2.4 billion in third-party mutual funds, pension plans and foundations, and approximately $9.2 billion in assets under a variety of mandates for CMA Holdings and CMA. Institutional assets accounted for approximately 84 per cent of Saxon's total AUM at June 30, 2008. Saxon had secured a prominent asset management profile within CMA Holdings through fixed income and equity mandates and through the distribution of Saxon Mutual Funds to CMA Holdings' clients. CMA Holdings represented Saxon's largest institutional client, with approximately $9.2 billion in assets currently managed pursuant to a variety of mandates. MD Management, a subsidiary of CMA Holdings, represented a significant thirdparty distribution channel for Saxon Mutual Funds. The relationship with CMA was often cited by research analysts as a key strength of Saxon as it enabled Saxon to provide mutual funds to all doctors in Canada, a group with very high disposable incomes and a very high propensity to invest. Saxon's Private Clients Saxon's also had a very small division that provided discretionary investment management to high net worth individuals. Total AUM at June 30, 2008, was insignificant at around $230 million, representing approximately two per cent of Saxon's total AUM. Exhibit 7a SAXON FINANCIAL STATEMENTS - INCOME STATEMENT Exhibit 7b SAXON FINANCIAL STATEMENTS - CASH FLOW STATEMENT chance of success as most shareholders would feel like they were "losing" on their investment. The ACB was $15.54 over the past six months and $16.50 over the past 12 months. On the other hand, the company knew that one of the primary reasons that acquisitions had historically failed to deliver long-term value for the buyer was because most acquirers were deemed to overpay. There was clearly a trade-off between coming up with an attractive initial bid, which would lock up enough shareholders to close the deal without any delays, proxy fights or poison pills, versus avoiding overpaying and ending up with a negative EPS accretion (i.e. a decrease in the earnings per share of the acquiring company) for the purchase. Financing the Acquisition IGM was considering paying for the acquisition using cash or through the issue of IGM common shares to the owners of Saxon. By issuing new shares, IGM risked decreasing the earnings per share of IGM, a result that would not be looked on favourably by the investment community. Thus one of the considerations was to ensure that the transaction would be accretive (or at least would not result in negative accretion) to earnings per share of IGM. The Decisions With fewer than three days left until the offer was to be made, many questions still remained to be answered. Did the acquisition of Saxon make strategic sense? Should IGM wait for the equity market to calm down before making the bid? What price should it pay, and would the transaction be accretive to IGM earnings per share? Exhibit 5b IGM FINANCIAL STATEMENTS - CASH FLOW Exhibit 5c IGM FINANCIAL STATEMENTS - BALANCE SHEET Saxon's Investment Returns and Financial Performance Saxon derived its revenue primarily from management fees charged to their mutual fund, institutional and private clients. Management fees were calculated as a percentage of the market value of AUM and, consequently, management fees fluctuated as the market value of AUM changed (see Exhibit 7). Operating expenses included expenses that were directly related to the level of AUM, such as trailer commissions, 4 investment sub-advisory fees 5 and custody expenses, and general and administrative expenses associated with Saxon's operations. Despite relatively weak investment returns in the past year (only 37 per cent of the company's mutual funds were in the first or second quartile over the past year), Saxon still had a strong reputation as a successful asset manager. Despite strong AUM growth, significant increase in EPS, a captive customer base (Canadian doctors) and a reputation as good "stock pickers," Saxon's share price performance had been poor (see Exhibit 8). Short-Term Goals It was rumoured that in late December 2007, Saxon's board of directors had established a special committee composed of the company chairman and key shareholders. The committee's purpose was to identify and consider any strategic alternatives that could potentially maximize shareholder value. Valuation of Saxon A key issue facing IGM was to determine what valuation method (including discounted cash flow, precedent transactions and trading comparables) would produce the most accurate and fair value for Saxon. If these methods provided widely different values, how should they be reconciled? Discounted Cash Flow (DCF) Historical financial statements for Saxon (see Exhibit 7), analysts' publicly disclosed projections for the next two years for the peer group (see Exhibit 9) and data obtained privately from buy-side analysts showed that analysts were expecting key financial metrics to perform as follows: - Significant decrease in revenue by 10 per cent in 2008 (due to difficult equity markets) followed by a sharp increase of 16 per cent in 2009. Starting in 2010, yearly revenues could increase by six per cent, five per cent and four per cent respectively, after which a terminal value should be applied. - EBITDA margin would recover to a 45 per cent level. - Taxes would remain steady at 34.5 per cent. - Terminal Value - most analysts assumed four per cent growth rates starting in 2013. - Synergies - back-office operations at Saxon currently amounted to about $10 million per year. Research analysts expected that about $5 million annually could be saved in case of any mergers and acquisitions (M\&A) transaction. Exhibit 5a IGM FINANCIAL STATEMENTS - INCOME STATEMENT Exhibit 11 SAXON SHAREHOLDER COST BASE BASED ON ONE FULL TURN OF FLOAT In August 2008, IGM Financial was working on the final details regarding the proposed acquisition of Saxon Financial Inc. (Saxon). In preparation for a public offer for all the outstanding shares of Saxon, the company wanted to review the strategic rationale, the proposed transaction value and the impact of the acquisition on IGM. THE FINANCIAL ASSET MANAGEMENT INDUSTRY Both Saxon and IGM operated within the Canadian asset management industry, which consisted of three principal segments: mutual funds, institutional asset management and private clients who were labelled as high net worth individuals (HNWI) (see Exhibit 1). The industry as a whole had experienced tremendous growth, with mutual fund assets alone increasing from \$3.6 billion in 1980 to \$696 billion in 2007. Asset management firms could be broadly grouped into three main categories, based on the type of the clients they served: - Group 1 consisted of large pension funds such as the Canada Pension Plan, Caisse de Depot et Placement du Quebec, or Ontario Teachers' Pension Plan. This group managed money on behalf of millions of Canadians by investing the assets (i.e. pension contributions) directly into equity, debt or private market or, in some cases, "funds of funds" managed by other financial institutions. - Group 2 was made up of bank-owned subsidiaries such as RBC Asset Management and TD Asset Management, along with mass market mutual fund companies such as AGF Management and IGM. This group offered two main product lines: mutual funds targeted toward small retail investors (essentially the investing public) and products targeted towards large institutional clients such as corporate pension funds, endowment funds and union pension funds (essentially, Group 1 as defined above). These products were commonly referred to as segregated or pooled funds. - Group 3 comprised a large number of small-sized asset managers (private companies and publicly traded firms with small capitalization). Their core product offering was segregated or pooled funds Internal data suggested that the risk-free rate was 3.66 per cent, the market risk premium was 7.42 per cent, the small cap risk premium was 1.74 per cent and Saxon's two-year beta was 0.62 . Most asset managers charged monthly management fees; therefore, cash flows were expected to come in evenly throughout the year. At the earliest, the transaction would close on October 1, 2008. Thus it was appropriate to include only one-quarter of the 2008 cash flows in the DCF calculation. For simplicity, it was assumed that all annual cash flows beyond 2008 would occur at the end of the respective years. Comparables An important aspect of the valuation of Saxon would be the selection of the "right" comparable companies. A list of companies had been provided by investment bankers (see Exhibit 9), but it was challenging to determine which companies were truly comparable. - Sprott - over 52 per cent of its AUM was in mutual funds, and 24 per cent was in hedge funds, both of which provided significantly higher base fees as compared to segregated or pooled funds. Most of Saxon's assets were institutional assets. - Gluskin - a strong track record (outperformed S\&P-TSX in the past 21 of 23 years) enabled the firm to charge exceptionally high performance fees. Most of its assets (about 90 per cent) were managed for HNWI, which attracted higher base fees plus performance fees. - AGF and Dundee - both much larger in size and with a primary focus on mutual funds. - Guardian Capital - similar market capitalization and AUM size to Saxon. AUM split was about twothirds institution and one-third retail market. - Jovian Capital - similar market capitalization and AUM size to Saxon. - Seamark Asset Management - smaller in size but very similar in focus; over 60 per cent of AUM in institution funds. Precedent Transactions Another method of valuing an acquisition was to look at other transactions that were viewed as comparables to the one being contemplated. The company had data on precedent transactions going back to 2000 (see Exhibit 10), grouped by asset class. Average Cost Base Since Saxon's share prices had been declining over the past year and a premium bid to the last closing price may not look very attractive to existing shareholders, it was important to determine the average price at which Saxon's shareholders had originally purchased their shares. This was called the average cost base (ACB). Calculating the ACB was imprecise but could be an important factor in any M\&A deal. Estimated float (total shares outstanding less shares owned by the two founders and CDA) was estimated to be around 7.4 million shares, and, based on historical trading volumes, it was determined that it took just over two years 6 for full turnover of float to occur with a corresponding average price of about $21.20 (see Exhibit 11). Investment bankers explained to the company that a bid below $21.20 would have little Exhibit 3 IGM ASSETS UNDER MANAGEMENT Exhibit 4 IGM EARNINGS BEFORE INTEREST AND TAXES SAXON SHARE PRICE PERFORMANCE AUG 1-2007 TO AUG 1-2008 IGM SHARE PRICE PERFORMANCE AUG 1-2007 TO AUG 1-2008 Source: Bloomberg. Exhibit 7c Exhibit 7d SAXON AUM BY BUSINESS SEGMENT Exhibit 1 CANADIAN ASSET MANAGEMENT INDUSTRY IN 2007 Source: The Investment Funds Institute of Canada, Investor Economics Exhibit 2 TEN LARGEST MUTUAL FUND MANAGERS IN CANADA Source: The Investment Funds Institute of Canada, August 2008. MFC generated revenue primarily through management fees (about 81 per cent of total fees earned in 2007) charged to mutual funds, as well as through sub-advised 3 and institutional accounts. Mutual funds comprised over 70 per cent of total AUM. MFC also earned fees for administrative and other services. Similar to Investor Group, the key earnings driver was the value of AUM. IGM Investment Returns and Financial Performance Most analysts rated IGM a buy' (as were companies such as Merrill Lynch, General Electric, Bear Stern, Toyota Motors and Lehman Brothers), with a target price based on very strong historical financial performance that was far above current trading levels. Earnings per share (EPS) had increased from $2.04 in 2003 to $3.32 in 2007 (see Exhibits 5a, 5b and 5c). IGM led the entire universe of asset managers in operating margin. The company's 45 per cent operating margin level for 2007 easily surpassed the 30 per cent to 33 per cent average for the group. This was likely due to Investor Group's exclusive distribution system and to IGM's scale benefits in Canada. However, the stock had been under pressure for the past 12 months (see Exhibit 6). This was due to: - Subpar investment returns - lower net inflows into its mutual funds were occurring due to IGM's lower relative performance, which was hurting new sales. Only about 30 per cent of its funds were in the first or second quartile versus 88 per cent for its nearest competitors such as RBC Asset Management. - Global equities market turmoil - total Canadian mutual fund AUM in August 2008 of $696 billion was down two per cent from its high in May 2007, and AUM growth had fallen in four of the past five quarters. - Weak organic growth - despite its No. 2 ranking in mutual fund AUM, IGM's average organic growth (growth of assets before net sales) trailed its Canadian peers, placing it ninth out of the top 10. The issue was predominantly in the MFC division, which had posted four straight quarters of negative organic growth. Outlook and Short-Term Goals To deal with the above-mentioned challenges, IGM's management indicated it was actively looking to expand the company's presence in the institutional sector to further take advantage of existing economies of scale. Management was also looking to expand into the HNWI sector to capture the projected aboveaverage growth rates of AUM within the HNWI segment, possibly through a merger or acquisition transaction. Based on analyst consensus for 2009, IGM was expected to earn about $927 million, which would result in EPS of $3.49 based on 265.75 million shares outstanding. Given the current share price of $43.60, this resulted in a 2009 estimated price to earnings (P/E) ratio of 12.5 times, which was 15 per cent below IGM's five-year historical ratio of 14.6x and below the Canadian asset manager index forward P/E of 15.0x. On a relative basis, IGM was viewed as an attractive buy by the analysts, but perhaps the lower P/E ratio was fully justified, given its recent performance, and analysts were simply too optimistic about IGM's longterm growth potential targeted at smaller institutional clients and, in some cases (Saxon being one of them), mutual funds were offered as well. HNWI were serviced by Groups 2 and 3. The business model (i.e. how asset managers made money) could be captured by a few key concepts. The key earnings driver was the level of assets under management (AUM). AUM was, in turn, driven by three factors: - Gross Sales - sales of financial products to new investors or in-kind transfer-in from other financial institutions; - Redemptions - cash withdrawals or in-kind transfer-out to other financial institutions; and - Net Asset Value - primarily driven by overall equity market conditions. Essentially, firms had to successfully gather and maintain financial assets on which they could charge management fees which ranged from 0.50 per cent of AUM for institutional money to 2.25 per cent for mutual funds. At the same time, firms had to manage operating expenses. Most of the operating costs were directly related to the level of AUM and hence to revenue. With salaries, bonuses and commissions tied to size and performance of funds, the key to high EBITDA amount and stable EBITDA margin was, therefore, the ability to maintain a similar product mix and keep commission payouts stable while growing the size of AUM. The four key success factors were: - Increased demand by savers - based on underlying demographics, the demand for savings vehicles had been steadily increasing. These new inflows averaged about three per cent to four per cent of total assets already invested. Since net switching by savers from one fund to another was modest, new inflows represented the greatest opportunity for the growth of new firms relative to existing players. - Equity and debt market performance - the value of AUM was highly sensitive to the performance of the financial markets. As the value of equities grew over time, there was a natural increase in AUM. This growth due to recent strong markets accounted for a far greater increase in AUM than did new sales. - Individual firm performance - most asset managers tried (and often failed in the long run) to consistently earn above-market returns. There was a tendency for investors to invest new funds and retain existing funds with asset managers that ranked within the top two quartiles of market performance. - Product innovation - the overwhelming majority of academic studies had demonstrated that most financial innovations in the asset management industry did not increase the upside potential for investors, but products such as Manulife's IncomePlus provided significant benefit to investors in the form of downside protection in the Retirement Risk Zone. 2 Such innovations contributed greatly to increase margins and market share for the firms that designed and marketed them. Such innovation had accelerated since the mid-1990s. IGM IGM was a large, publicly traded, asset management company that was a part of the large Canadian financial conglomerate. Its parent company directly owned 56 per cent of IGM and 70 per cent of a large Canadian insurance firm. The company operated primarily through its two wholly owned divisions, Investors Group and Mackenzie Financial Corporation, which comprised roughly 68 per cent and 28 per 2 "Retirement Risk Zone" - This was defined as the five to 10 years before and after investors reach retirement, i.e., when their portfolios are most vulnerable to market downturns and volatility. IncomePlus provided guaranteed monthly payments independent of when an investor retired in the market cycle, as well as growth potential, flexibility and control. cent of earnings, respectively. IGM was Canada's second-largest mutual fund asset manager (see Exhibit 2 ), with a 15 per cent market share and over $104 billion in mutual fund assets under management. Mutual funds made up approximately 90 per cent of IGM's total AUM. IGM represented a prime example of a Group 2 asset management firm, as defined above. Investors Group Investors Group comprised roughly 57 per cent of IGM's revenue and 68 per cent of its earnings before interest and taxes (EBIT). Investors Group provided financial planning advice and services - including investment, retirement, estate and tax planning - through a network of more than 4,300 exclusive consultants (i.e. working only for IGM) by offering an extensive array of Investors Group managed mutual and money market funds, mortgage products, and insurance and banking products from various third-party companies. - Brokerage Division - Clients could open accounts such as registered retirement savings plans (RRSPs), registered retirement income funds (RRIFs) and registered education savings plans (RESPs) and purchase securities such as bonds, debentures, stocks, treasury bills, guaranteed investment certificates (GICs), and commercial paper on top of the wide variety of mutual and money market funds offered. - Investment Division - As Canada's largest mutual fund company, Investors Group had the resources and expertise to deliver a complete line of mutual funds and money market funds. - Mortgage Division - As a residential mortgage lender, Investors Group offered a multitude of both fixed and variable rate mortgage products. Investors Group consultants were teamed up with a mortgage planning specialist to simplify the complex mortgage process and ensure that their mortgage was an integral part of client's overall financial plan. - Insurance Division - Investors Group's consultants were able to offer a full suite of life insurance and living benefits products through their partners such as Canada Life, Great-West Life, Manulife and Sun Life. Also available was a complete product package that spanned term life insurance, permanent participating life, universal life, disability, critical illness, long-term care, health and dental insurance. - Banking Division - Investors Group had teamed up with the National Bank of Canada to offer comprehensive banking solutions. Investors Group earned revenue (about 77 per cent of total fees earned in 2007) primarily through management fees charged to its mutual funds. For the last several years, the group had experienced a steady growth in both AUM and EBIT (see Exhibits 3 and 4). The funds were distributed through the company's consultant network, which had grown in numbers for 16 straight quarters to 4,360 members as of the second quarter of 2008. As with other asset managers, the key earnings driver was the level of AUM. Mackenzie Financial Corporation Division The Mackenzie Financial Corporation division (MFC) accounted for approximately 37 per cent of IGM's revenue and 28 per cent of its EBIT. MFC was one of Canada's premier investment managers, providing investment advisory and related services in North America. MFC's core business provided investment advice and services through independent financial advisor channels, (i.e. sold products on behalf of various financial institutions, not just IGM's, as was the case with the Investor Group unit). MFC distributed its investment products and expertise through a sophisticated network of third-party financial advisors. MFC's wholesale teams worked with many of the more than 30,000 independent financial advisors across Canada
Step by Step Solution
There are 3 Steps involved in it

Get step-by-step solutions from verified subject matter experts