

Question: a. Insert a copy of your graph of the autocorrelation function (ACF) for the weekly closing stock prices data. b. On the basis of your
a. Insert a copy of your graph of the autocorrelation function (ACF) for the weekly closing stock prices data.
b. On the basis of your ACF alone, state whether or not, the data are trended over time and explain the basis of your choice.
c. On the basis of the ACF alone, state whether or not the data are serially correlated in time and explain the basis of your decision.
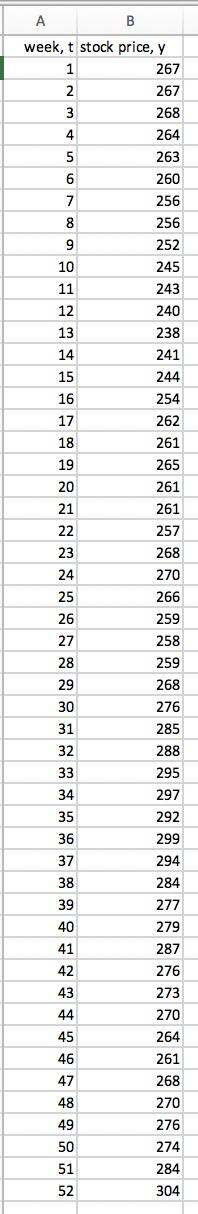
A week, t stock price, y 1 267 2 267 3 268 4 264 263 260 256 256 252 10 245 11 243 240 238 14 241 15 244 254 262 261 261 21 261 22 257 268 270 266 259 258 259 29 268 276 285 288 295 297 292 299 37 294 284 277 279 287 276 273 270 264 46 261 47 268 270 276 274 284 304
Step by Step Solution
There are 3 Steps involved in it

Get step-by-step solutions from verified subject matter experts
Document Format (2 attachments)
6363723e6057f_238002.pdf
180 KBs PDF File
6363723e6057f_238002.docx
120 KBs Word File