

Question: 2. A large beverage company would like to use statistical process control to monitor a new bottling machine designed to load liquid into 350ml bottles.
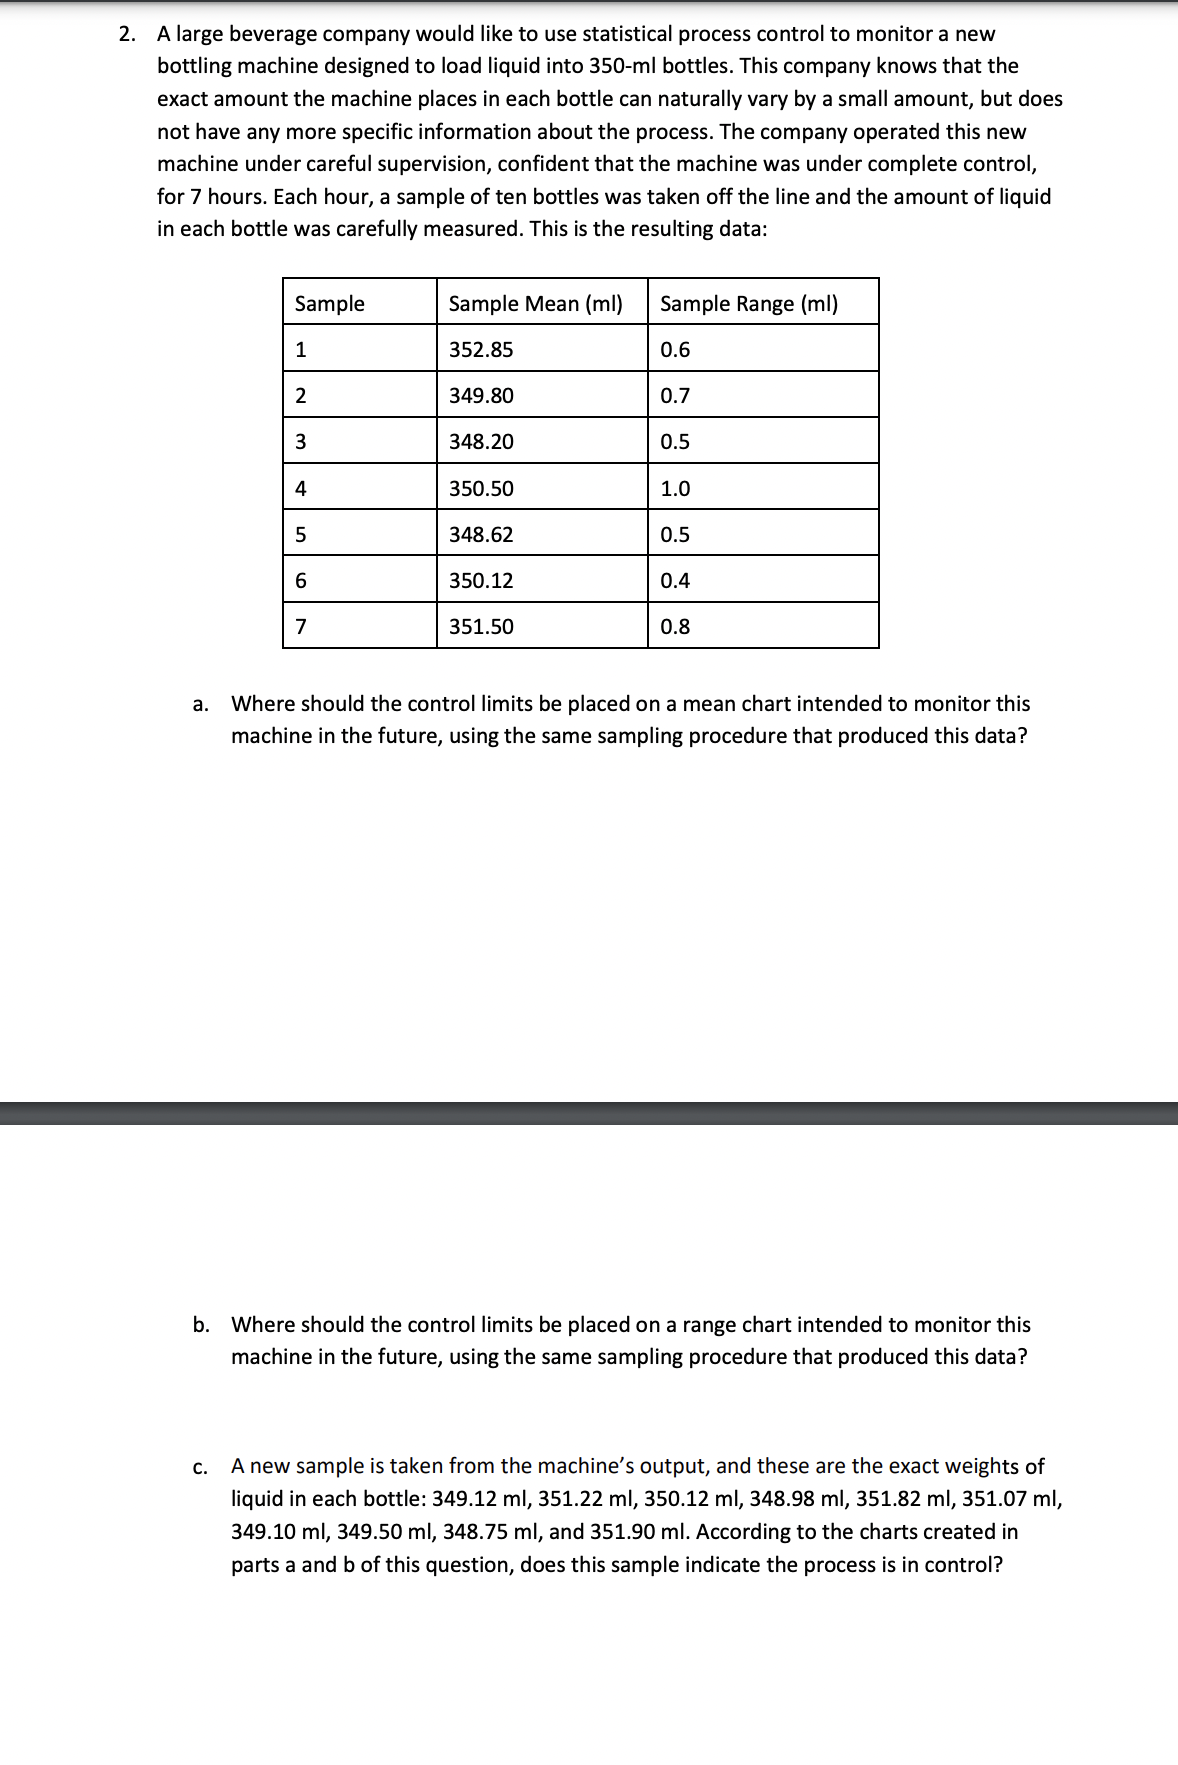
2. A large beverage company would like to use statistical process control to monitor a new bottling machine designed to load liquid into 350ml bottles. This company knows that the exact amount the machine places in each bottle can naturally vary by a small amount, but does not have any more specific information about the process. The company operated this new machine under careful supervision, confident that the machine was under complete control, for 7 hours. Each hour, a sample of ten bottles was taken off the line and the amount of liquid in each bottle was carefully measured. This is the resulting data: a. Where should the control limits be placed on a mean chart intended to monitor this machine in the future, using the same sampling procedure that produced this data? b. Where should the control limits be placed on a range chart intended to monitor this machine in the future, using the same sampling procedure that produced this data? c. A new sample is taken from the machine's output, and these are the exact weights of liquid in each bottle: 349.12ml,351.22ml,350.12ml,348.98ml,351.82ml,351.07ml, 349.10ml,349.50ml,348.75ml, and 351.90ml. According to the charts created in parts a and b of this question, does this sample indicate the process is in control
Step by Step Solution
There are 3 Steps involved in it

Get step-by-step solutions from verified subject matter experts