

Question: 2. What is the the upper control limit on the beverage companys mean chart? 3. Below are the readings associated with three additional samples of
2. What is the the upper control limit on the beverage companys mean chart?
3. Below are the readings associated with three additional samples of size 20, taken after the company drew its mean and range charts based on the data above. According to the companys new charts, which of these three additional samples indicate assignable variation is present in the process?
Sample I- Sample mean: 350.0 ml; Sample range: 0.5 ml
Sample II- Sample mean: 351.0 ml; Sample range: 1.5 ml
Sample III- Sample mean: 349.8 ml; Sample range: 1.3 ml
a) Sample I only b) Sample II only c) Samples I and III
d) Samples II and III e) Samples I, II and III
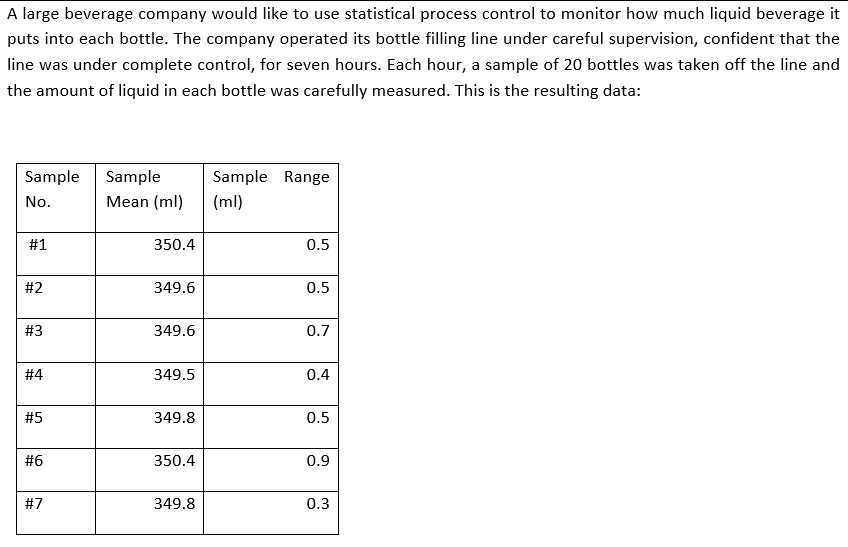
A large beverage company would like to use statistical process control to monitor how much liquid beverage it puts into each bottle. The company operated its bottle filling line under careful supervision, confident that the line was under complete control, for seven hours. Each hour, a sample of 20 bottles was taken off the line and the amount of liquid in each bottle was carefully measured. This is the resulting data: Sample No. Sample Mean (ml) Sample Range (ml) #1 350.4 0.5 #2 349.6 0.5 #3 349.6 0.7 #4 349.5 0.4 #5 349.8 0.5 #6 350.4 0.9 #7 349.8 0.3Step by Step Solution
There are 3 Steps involved in it

Get step-by-step solutions from verified subject matter experts