

Question: 2. A liquid is heated in a lab using a hot plate. The graph of temperature vs. time is as follows. Temperature of Solution
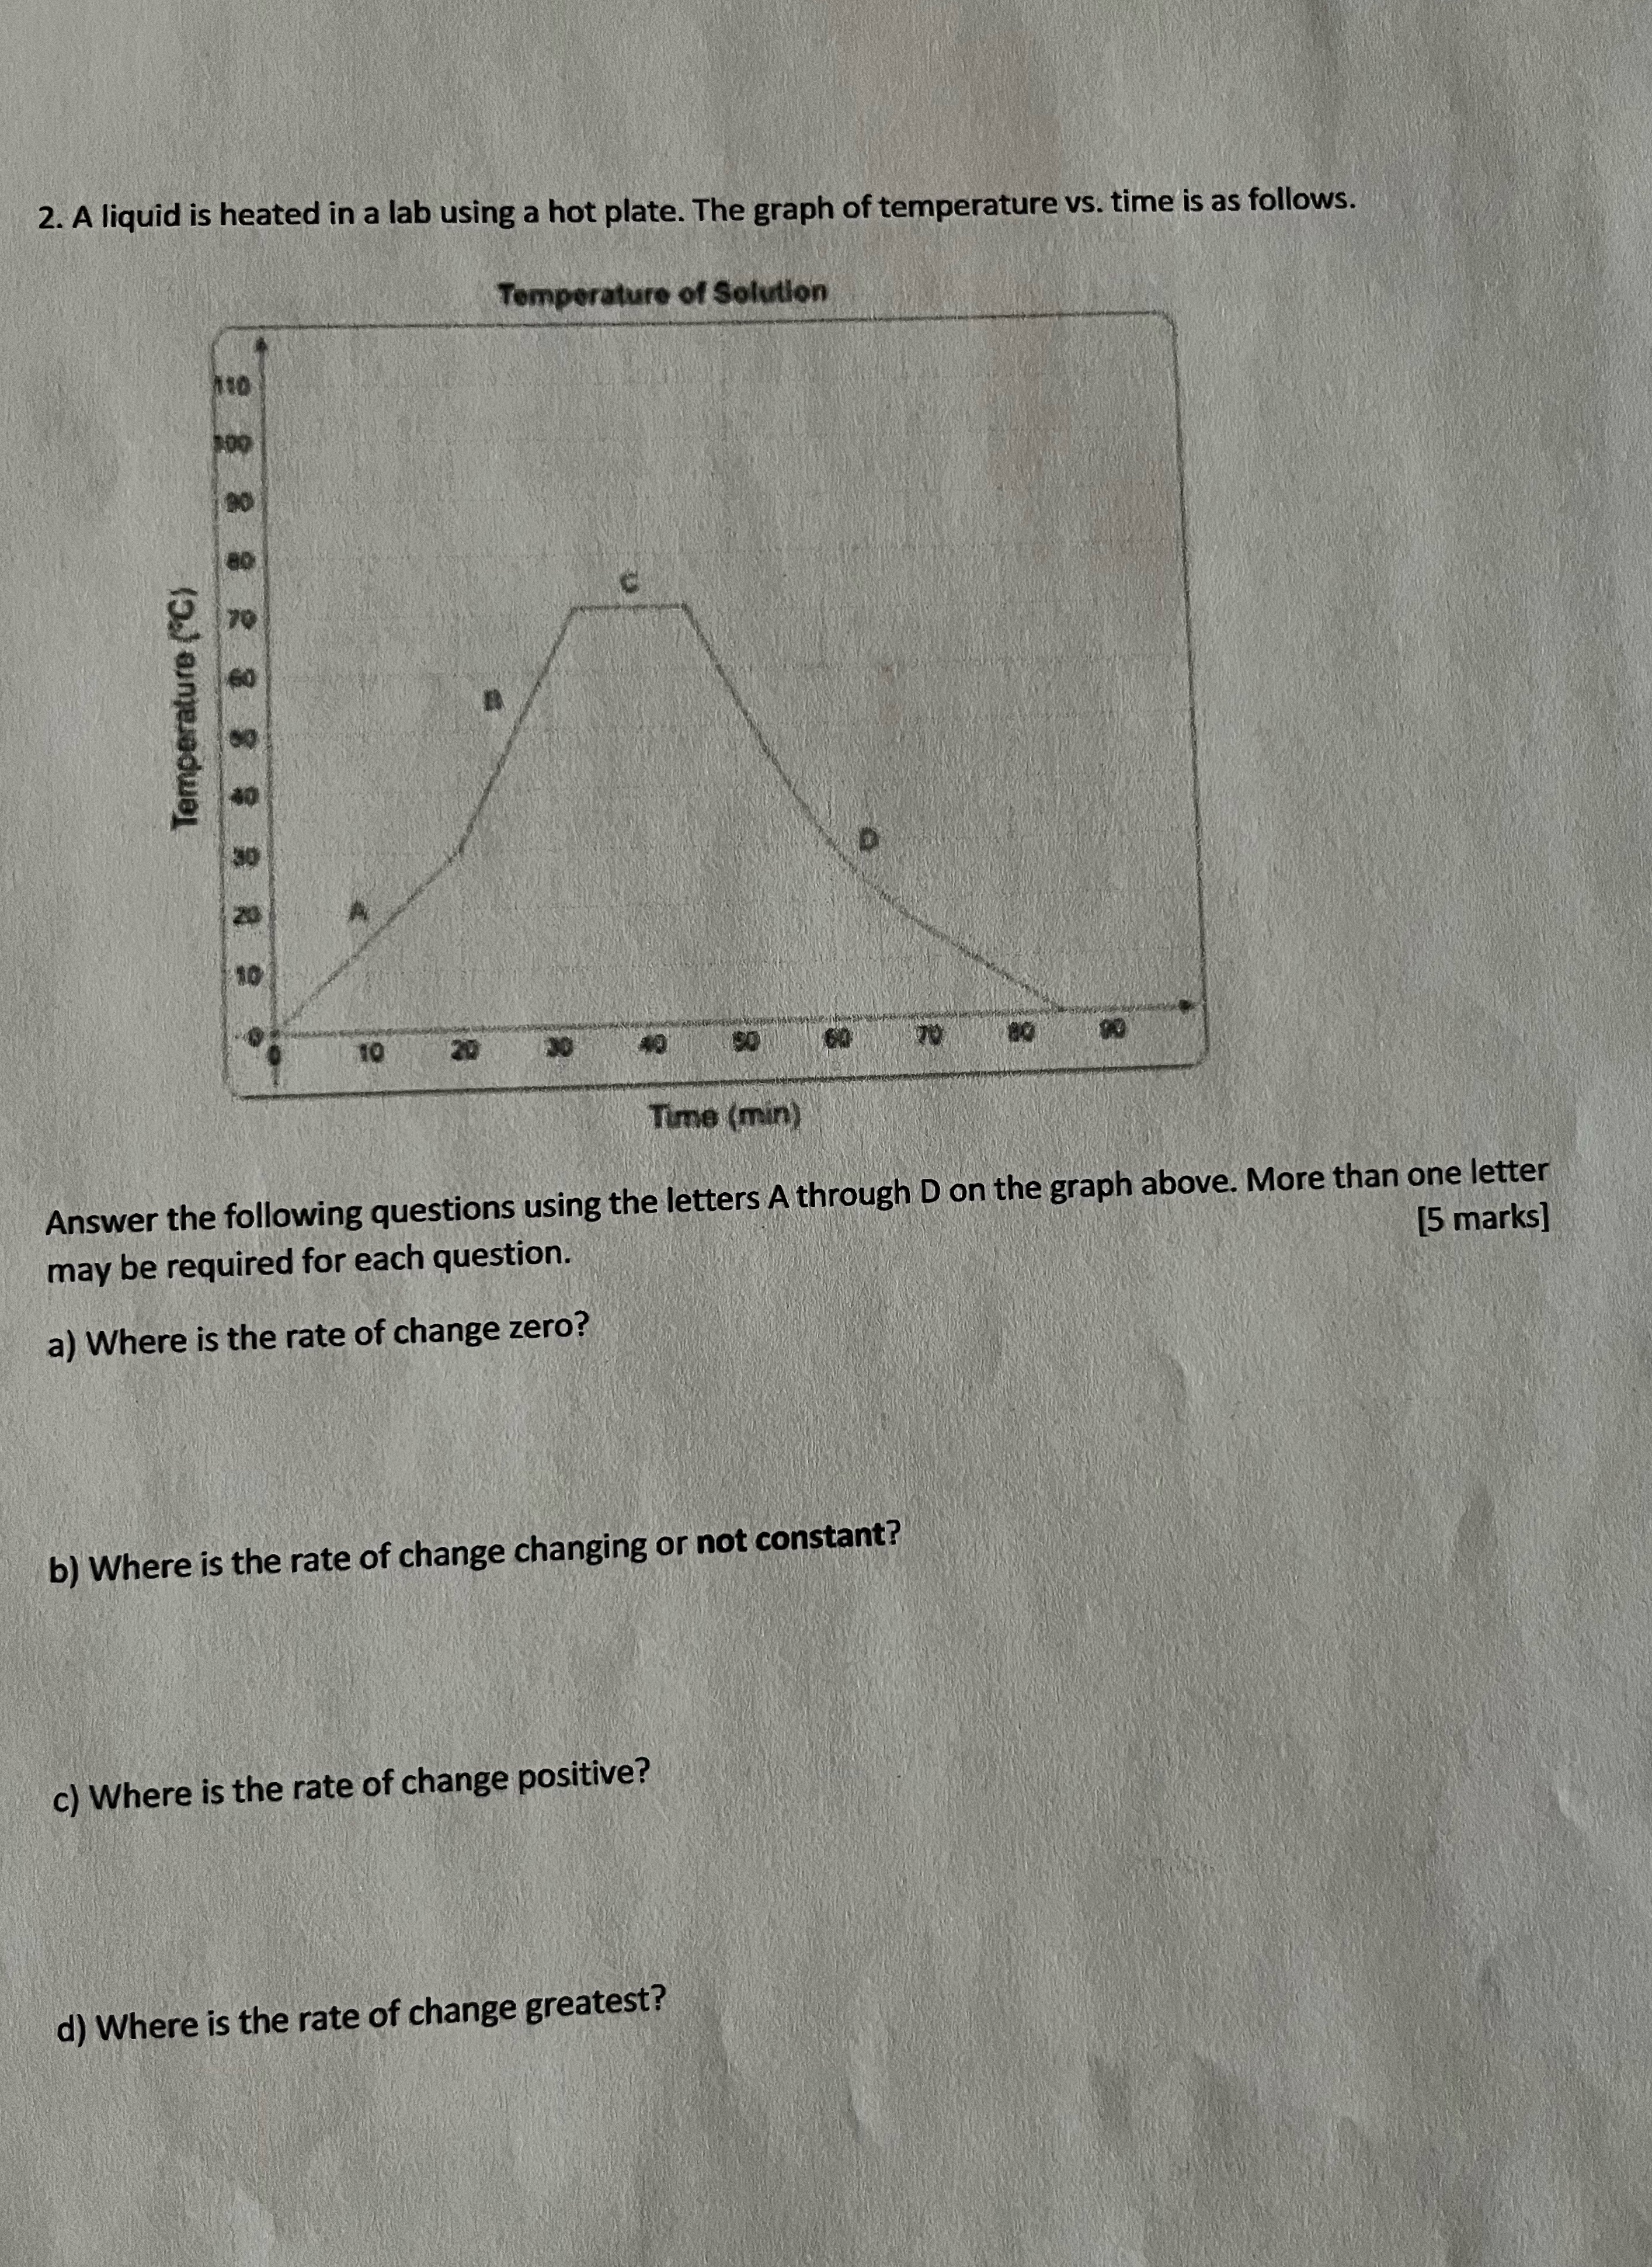
2. A liquid is heated in a lab using a hot plate. The graph of temperature vs. time is as follows. Temperature of Solution Temperature (C) 888R 8 8 8 8 8 9 110 200 10 20 40 50 60 70 90 Time (min) Answer the following questions using the letters A through D on the graph above. More than one letter may be required for each question. a) Where is the rate of change zero? [5 marks] b) Where is the rate of change changing or not constant? c) Where is the rate of change positive? d) Where is the rate of change greatest?
Step by Step Solution
There are 3 Steps involved in it
Lets analyze the graph step by step to answer the given questions a Where is the rate of change zero ... View full answer

Get step-by-step solutions from verified subject matter experts