

Question: 10. A liquid is heated in a lab using a hot plate. The graph of temperature vs. time is as follows. Temperature of Solution 110
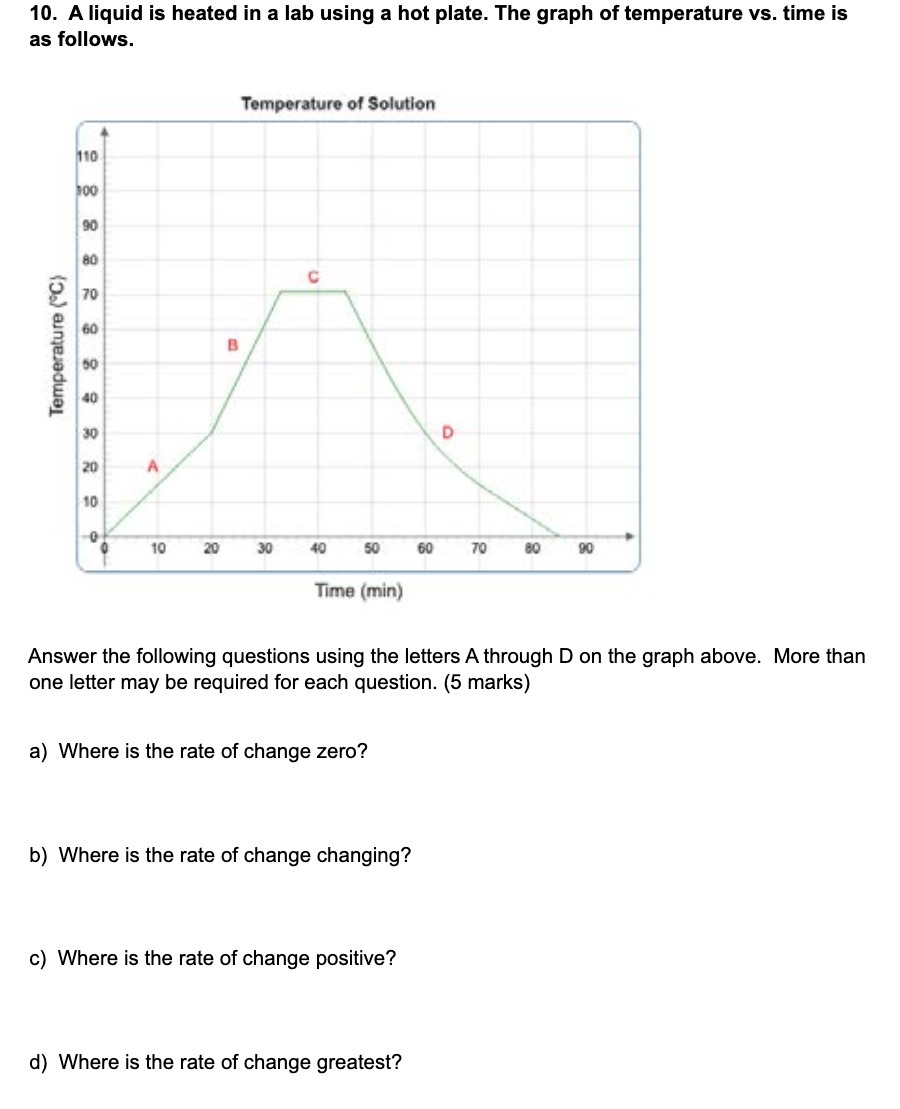
10. A liquid is heated in a lab using a hot plate. The graph of temperature vs. time is as follows. Temperature of Solution 110 100 90 80 C Temperature ("C) B 30 D 20 10 10 20 30 40 50 60 70 80 90 Time (min) Answer the following questions using the letters A through D on the graph above. More than one letter may be required for each question. (5 marks) a) Where is the rate of change zero? b) Where is the rate of change changing? c) Where is the rate of change positive? d) Where is the rate of change greatest
Step by Step Solution
There are 3 Steps involved in it
1 Expert Approved Answer
Step: 1 Unlock

Question Has Been Solved by an Expert!
Get step-by-step solutions from verified subject matter experts
Step: 2 Unlock
Step: 3 Unlock