

Question: 2. A phase diagram is shown below for an allotropic metal. Sketch and label possible Gibbs free energy curves for the 3 phases, as
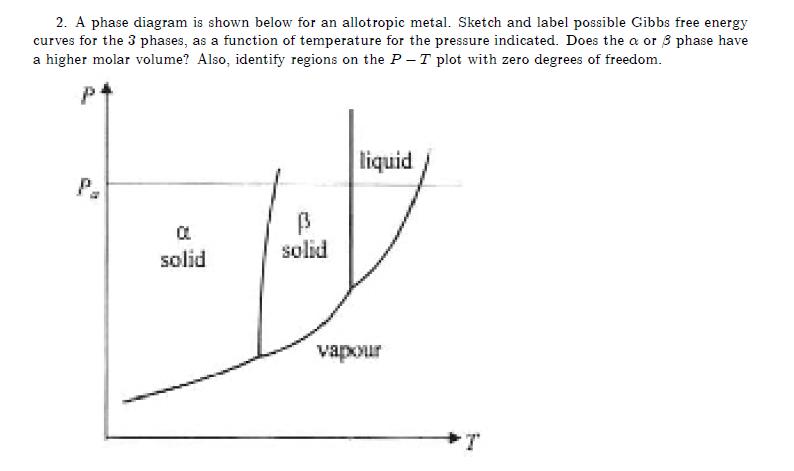
2. A phase diagram is shown below for an allotropic metal. Sketch and label possible Gibbs free energy curves for the 3 phases, as a function of temperature for the pressure indicated. Does the a or 3 phase have a higher molar volume? Also, identify regions on the P-T plot with zero degrees of freedom. P Pa liquid solid solid vapour T
Step by Step Solution
There are 3 Steps involved in it
1 Expert Approved Answer
Step: 1 Unlock

Question Has Been Solved by an Expert!
Get step-by-step solutions from verified subject matter experts
Step: 2 Unlock
Step: 3 Unlock