

Question: 2. A product is undergoing ALT test using different temperature. The data is shown in Table 2. Analyse the data (i) Identify the best distribution.
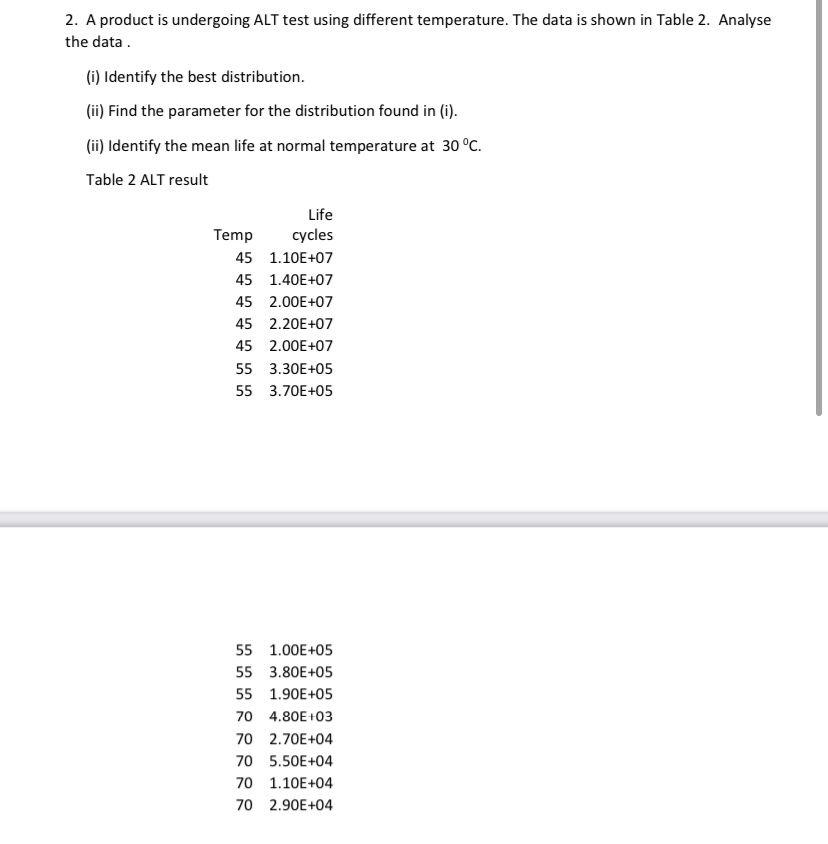
2. A product is undergoing ALT test using different temperature. The data is shown in Table 2. Analyse the data (i) Identify the best distribution. (ii) Find the parameter for the distribution found in (i). (ii) Identify the mean life at normal temperature at 30C. Table 2 ALT result Life Temp cycles 45 1.10E+07 45 1.40E+07 45 2.00E+07 45 2.20E+07 45 2.00E+07 55 3.30E+05 55 3.70E+05 55 1.00E+05 55 3.80E+05 55 1.90E+05 70 4.80E+03 70 2.70E+04 70 5.50E+04 70 1.10E+04 70 2.90E+04
Step by Step Solution
There are 3 Steps involved in it
1 Expert Approved Answer
Step: 1 Unlock

Question Has Been Solved by an Expert!
Get step-by-step solutions from verified subject matter experts
Step: 2 Unlock
Step: 3 Unlock