

Question: 2. A random sample of 195 students was selected from the United Kingdom using the CensusAtSchool data selector. The age (in years) x and height
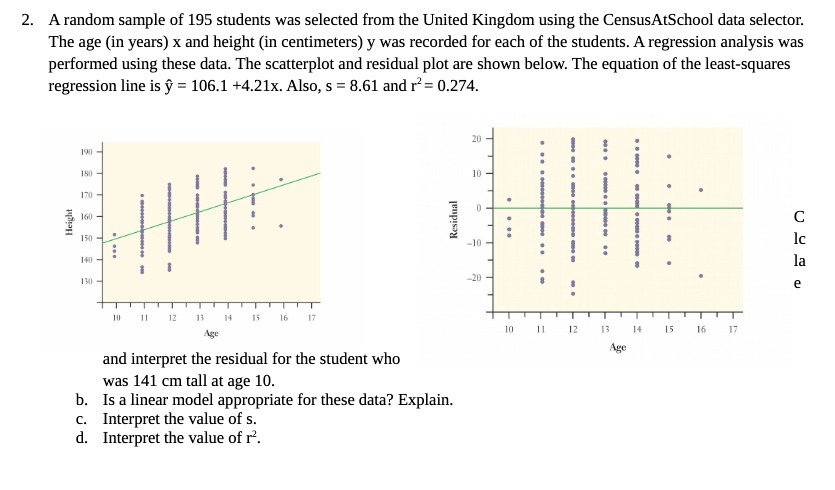
2. A random sample of 195 students was selected from the United Kingdom using the CensusAtSchool data selector. The age (in years) x and height (in centimeters) y was recorded for each of the students. A regression analysis was performed using these data. The scatterplot and residual plot are shown below. The equation of the least-squares regression line is y = 106.1 +4.21x. Also, s = 8.61 and r* = 0.274. 20 - 190 180 - 10 - 170 160 Residual Height C 150 - -10 la 130 -20 e 10 11 12 13 14 15 16 17 Age 10 11 12 13 14 15 16 17 Age and interpret the residual for the student who was 141 cm tall at age 10. b. Is a linear model appropriate for these data? Explain. C. Interpret the value of s. d. Interpret the value of r
Step by Step Solution
There are 3 Steps involved in it

Get step-by-step solutions from verified subject matter experts