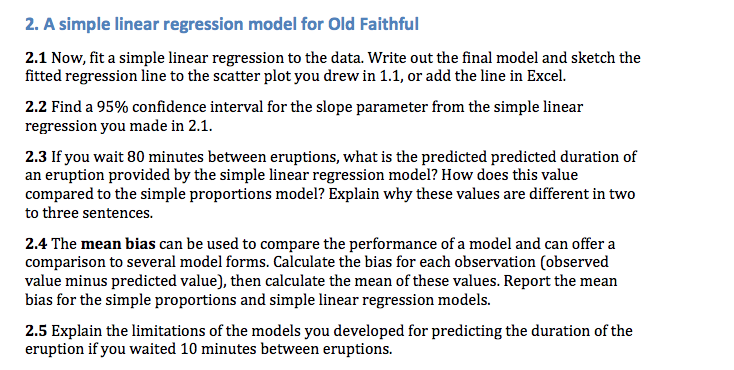
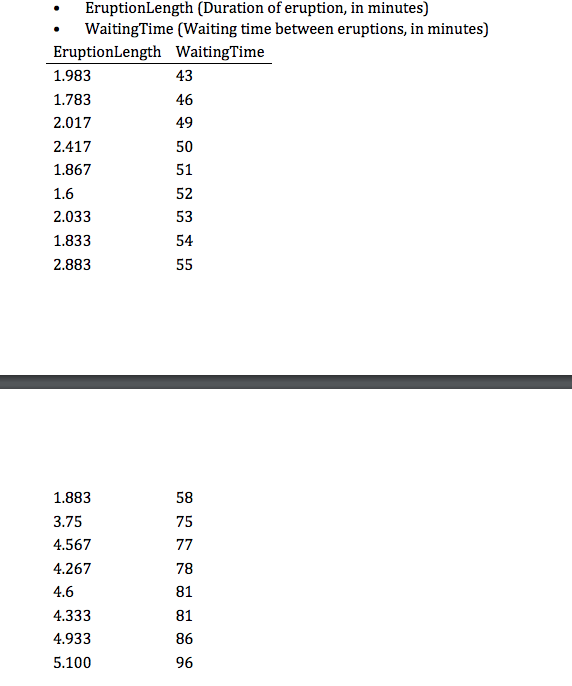
Question: 2. A simple linear regression model for Old Faithful 2.1 Now, fit a simple linear regression to the data. Write out the final model and

2. A simple linear regression model for Old2. A simple linear regression model for Old

2. A simple linear regression model for Old Faithful 2.1 Now, fit a simple linear regression to the data. Write out the final model and sketch the fitted regression line to the scatter plot you drew in 1.1, or add the line in Excel. 2.2 Find a 95% confidence interval for the slope parameter from the simple linear regression you made in 2.1. 2.3 If you wait 80 minutes between eruptions, what is the predicted predicted duration of an eruption provided by the simple linear regression model? How does this value compared to the simple proportions model? Explain why these values are different in two to three sentences. 2.4 The mean bias can be used to compare the performance of a model and can offer a comparison to several model forms. Calculate the bias for each observation (observed value minus predicted value), then calculate the mean of these values. Report the mean bias for the simple proportions and simple linear regression models. 2.5 Explain the limitations of the models you developed for predicting the duration of the eruption if you waited 10 minutes between eruptions. EruptionLength (Duration of eruption, in minutes) WaitingTime (Waiting time between eruptions, in minutes) EruptionLength WaitingTime 1.983 43 1.783 46 2.017 49 2.417 50 1.867 51 1.6 52 2.033 53 1.833 54 2.883 55 1.883 3.75 4.567 4.267 4.6 4.333 4.933 5.100 58 75 77 78 81 81 86 96

Step by Step Solution

There are 3 Steps involved in it

1 Expert Approved Answer
Step: 1 Unlock blur-text-image
Question Has Been Solved by an Expert!

Get step-by-step solutions from verified subject matter experts

Step: 2 Unlock
Step: 3 Unlock

Students Have Also Explored These Related General Management Questions!