

Question: 2. a) The graph below shows the market equilibrium for orange juice. Now suppose a severe frost in Florida were to seriously damage the
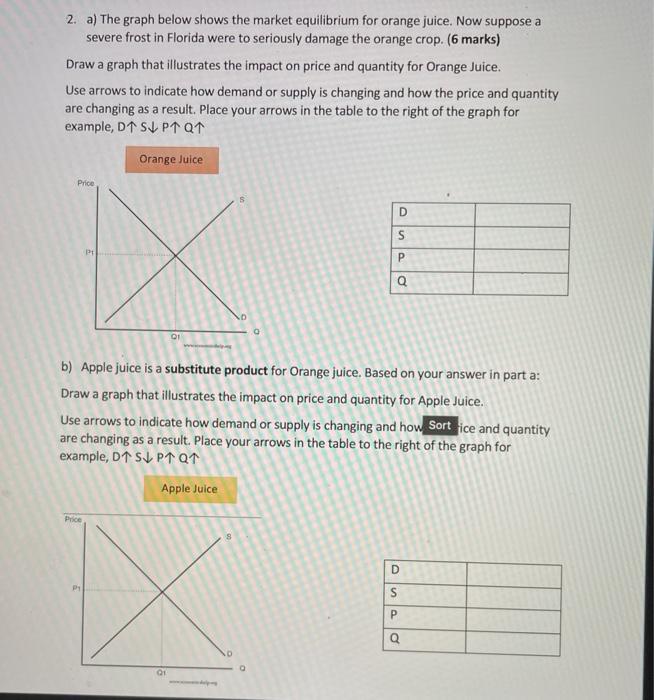
2. a) The graph below shows the market equilibrium for orange juice. Now suppose a severe frost in Florida were to seriously damage the orange crop. (6 marks) Draw a graph that illustrates the impact on price and quantity for Orange Juice. Use arrows to indicate how demand or supply is changing and how the price and quantity are changing as a result. Place your arrows in the table to the right of the graph for example, D S P Q Orange Juice Price Pi Price 01 Q1 S D S b) Apple juice is a substitute product for Orange juice. Based on your answer in part a: Draw a graph that illustrates the impact on price and quantity for Apple Juice. Use arrows to indicate how demand or supply is changing and how Sort ice and quantity are changing as a result. Place your arrows in the table to the right of the graph for example, D S PT QT Apple Juice P Q D P Q
Step by Step Solution
3.37 Rating (153 Votes )
There are 3 Steps involved in it

Get step-by-step solutions from verified subject matter experts