

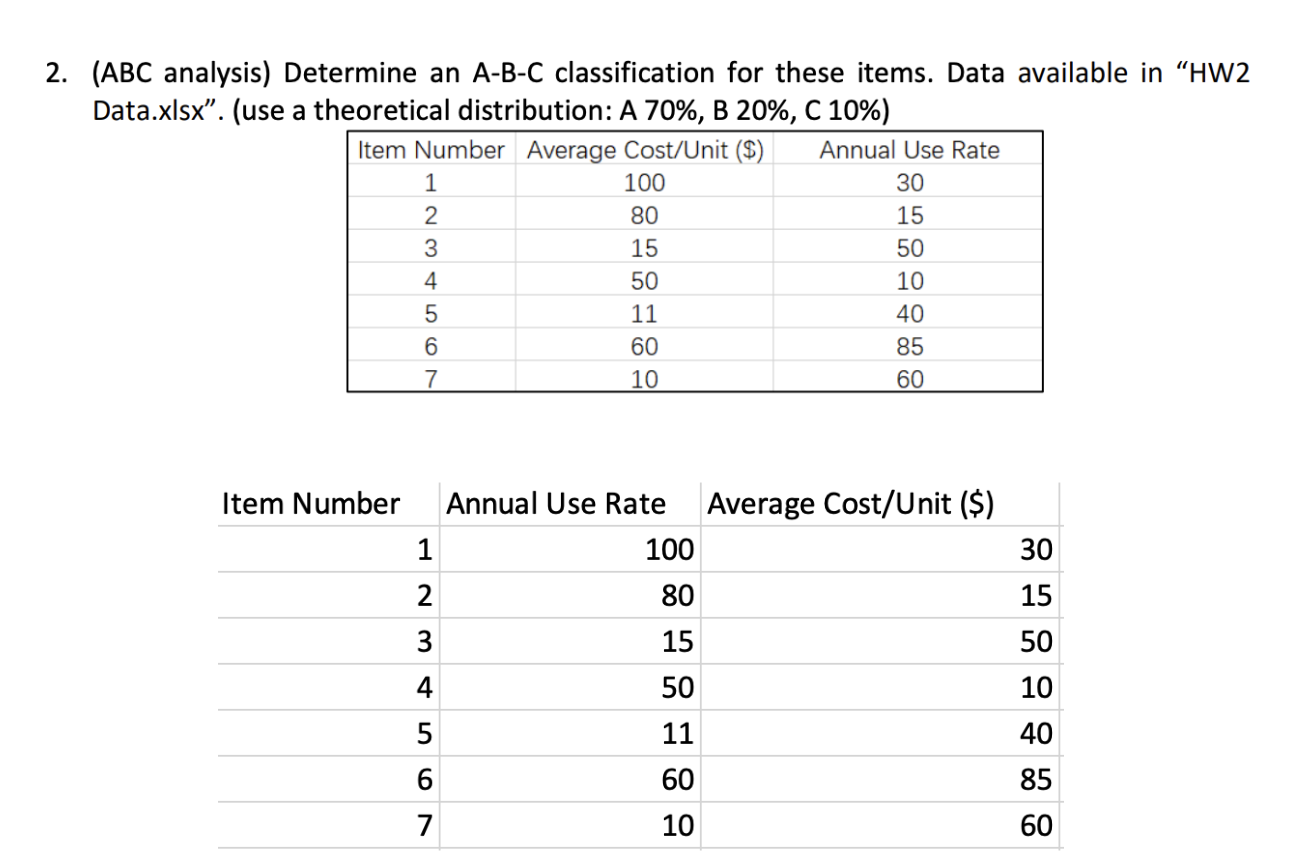
Question: 2 . ( ABC analysis ) Determine an A - B - C classification for these items. Data available in HW 2 Data.xlsx
ABC analysis Determine an ABC classification for these items. Data available in HW Data.xlsxuse a theoretical distribution: A B C
begintabularccc
hline Item Number & Average CostUnit $ & Annual Use Rate
hline & &
hline & &
hline & &
hline & &
hline & &
hline & &
hline & &
hline
endtabular
begintabularrrrr
hline Item Number & Annual Use Rate & Average CostUnit $
hline & &
hline & &
hline & &
hline & &
hline & &
hline & &
hline & &
hline
endtabular
Step by Step Solution
There are 3 Steps involved in it
1 Expert Approved Answer
Step: 1 Unlock

Question Has Been Solved by an Expert!
Get step-by-step solutions from verified subject matter experts
Step: 2 Unlock
Step: 3 Unlock