Question: 2. Also in Model 1 (Fig. 2), Does Awareness significantly affect Bias Severity? Is this true for both the US/China and Finland datasets? If yes
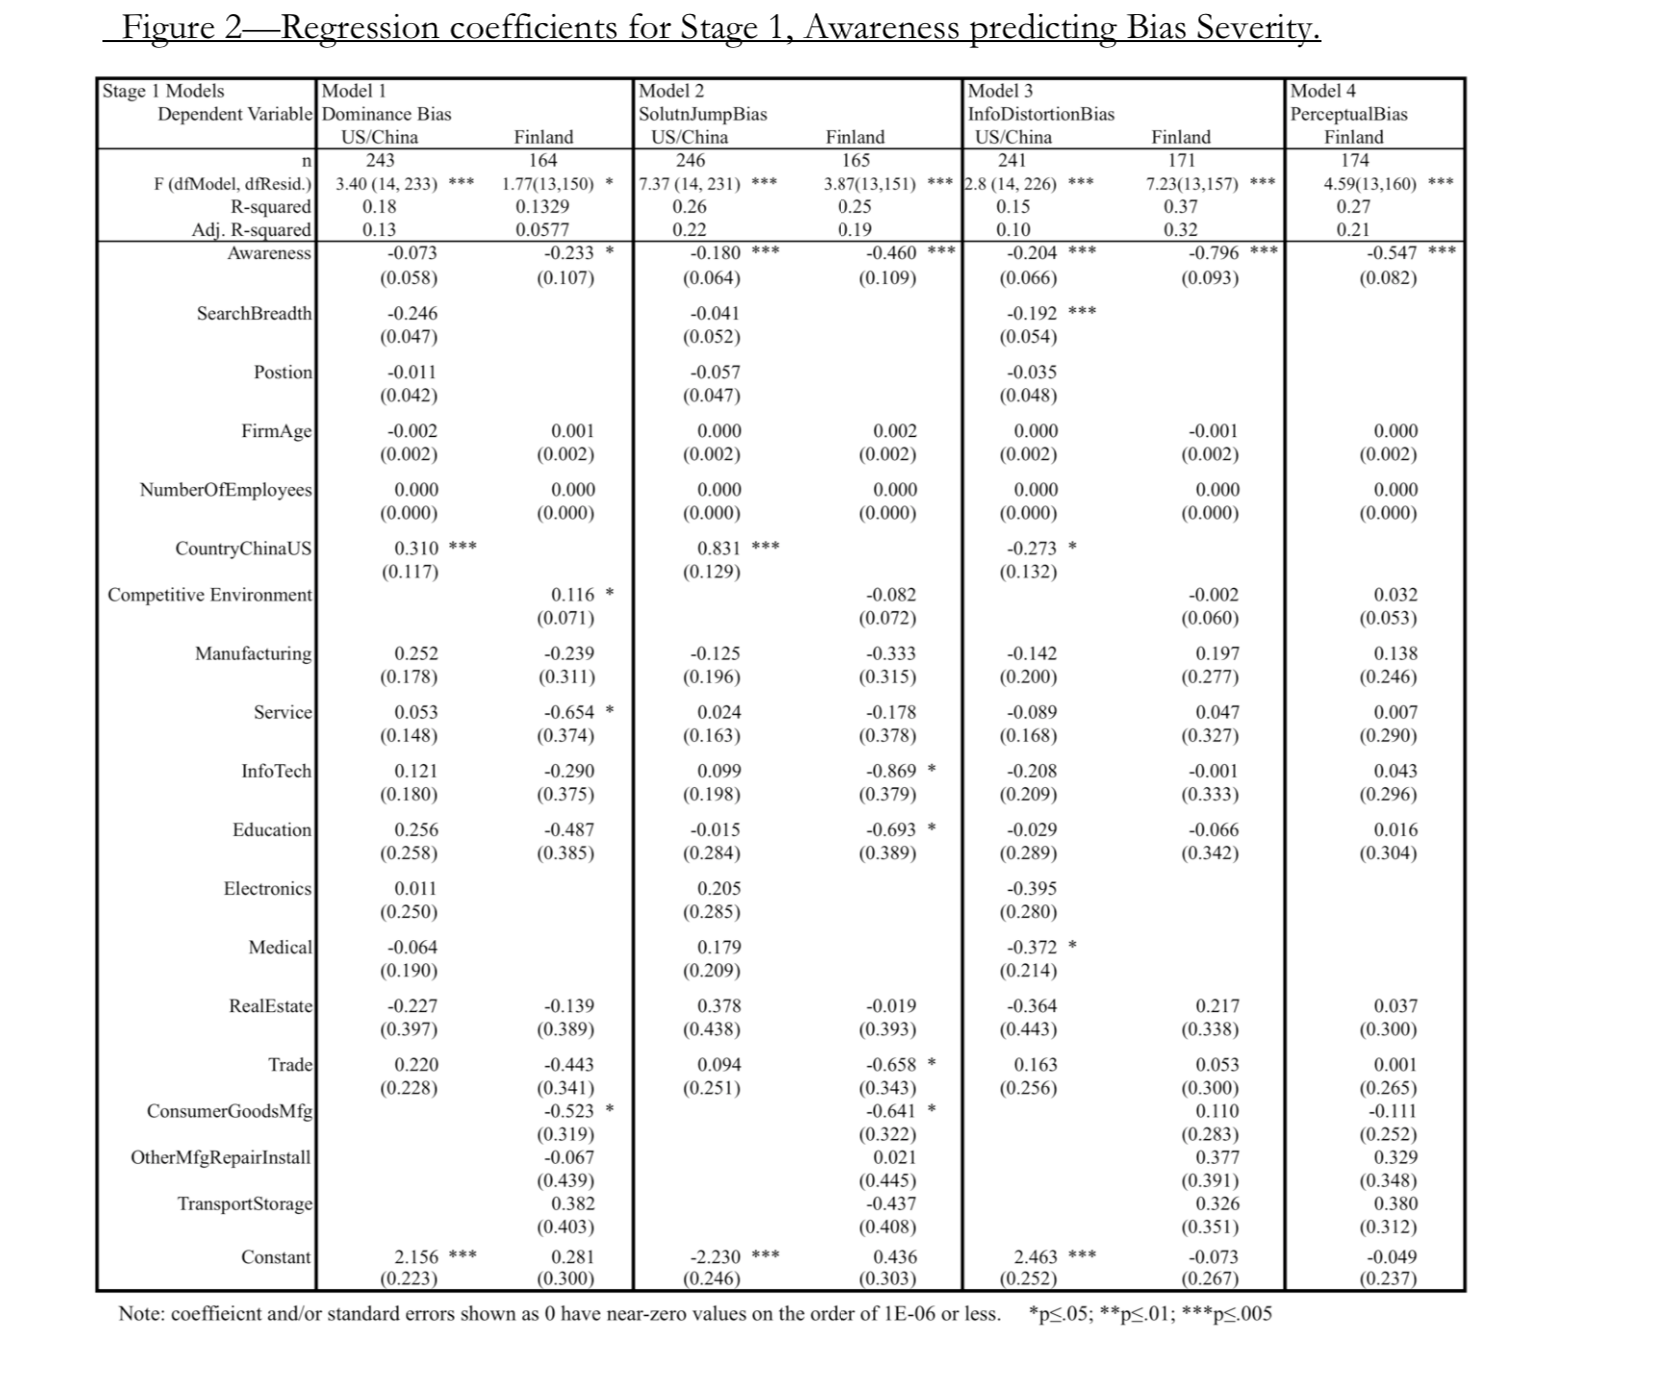
2. Also in Model 1 (Fig. 2), Does Awareness significantly affect Bias Severity? Is this true for both the US/China and Finland datasets? If yes for at least one dataset (and ONLY if yes,) what are the signs, magnitudes, and significance levels of any significant coefficients? What does this finding (or lack of a finding) mean? Your response should be one paragraph (or less) of explanation that covers these questions.
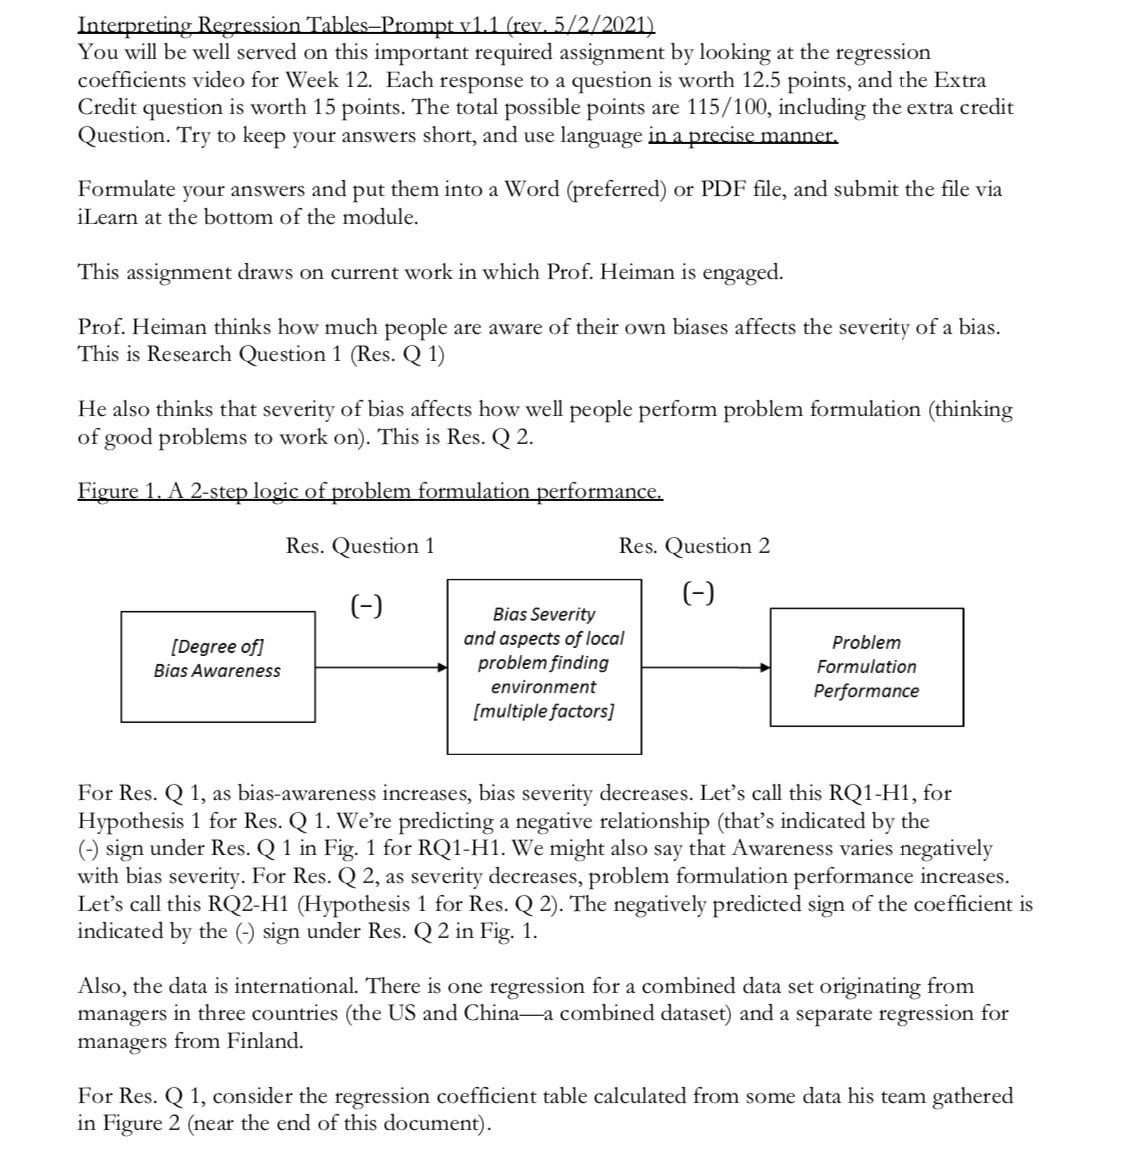
Interpreting Regression TablesPrompt v1.1 (rev. 5/2/2021) You will be well served on this important required assignment by looking at the regression coefficients video for Week 12. Each response to a question is worth 12.5 points, and the Extra Credit question is worth 15 points. The total possible points are 115/100, including the extra credit Question. Try to keep your answers short, and use language in a precise manner. Formulate your answers and put them into a Word (preferred) or PDF file, and submit the file via iLearn at the bottom of the module. This assignment draws on current work in which Prof. Heiman is engaged. Prof. Heiman thinks how much people are aware of their own biases affects the severity of a bias. This is Research Question 1 (Res. Q 1) He also thinks that severity of bias affects how well people perform problem formulation (thinking of good problems to work on). This is Res. Q 2. Figure 1. A 2-step logic of problem formulation performance. Res. Question 1 Res. Question 2 ( o [Degree of] Bias Awareness Bias Severity and aspects of local problem finding environment (multiple factors] Problem Formulation Performance For Res. Q 1, as bias-awareness increases, bias severity decreases. Let's call this RQ1-H1, for Hypothesis 1 for Res. Q 1. We're predicting a negative relationship (that's indicated by the (-) sign under Res. Q 1 in Fig. 1 for RQ1-H1. We might also say that Awareness varies negatively with bias severity. For Res. Q 2, as severity decreases, problem formulation performance increases. Let's call this RQ2-H1 (Hypothesis 1 for Res. Q 2). The negatively predicted sign of the coefficient is indicated by the (-) sign under Res. Q 2 in Fig. 1. Also, the data is international. There is one regression for a combined data set originating from managers in three countries (the US and Chinaa combined dataset) and a separate regression for managers from Finland. For Res. Q 1, consider the regression coefficient table calculated from some data his team gathered in Figure 2 (near the end of this document). Figure 2Regression coefficients for Stage 1, Awareness predicting Bias Severity. 171 0.310 *** -0.273 * 0.116 * Stage 1 Models Model 1 Model 2 Model 3 Model 4 Dependent Variable Dominance Bias SolutnJump Bias InfoDistortion Bias PerceptualBias US/China Finland US/China Finland US/China Finland Finland n 243 164 246 165 241 174 F (dfModel, dfResid.) 3.40 (14, 233) *** 1.77(13,150) * 7.37 (14, 231) *** 3.87(13,151) *** 2.8 (14, 226) *** 7.23(13,157) *** 4.59(13,160) *** R-squared 0.18 0.1329 0.26 0.25 0.15 0.37 0.27 Adj. R-squared 0.13 0.0577 0.22 0.19 0.10 0.32 0.21 Awareness -0.073 -0.233 * -0.180 *** -0.460 *** -0.204 *** -0.796 *** -0.547 *** (0.058) (0.107) (0.064) (0.109) (0.066) (0.093) (0.082) SearchBreadth -0.246 -0.041 -0.192 *** (0.047) (0.052) (0.054) Postion -0.011 -0.057 -0.035 (0.042) (0.047) (0.048) FirmAge -0.002 0.001 0.000 0.002 0.000 -0.001 0.000 (0.002) (0.002) (0.002) (0.002) (0.002) (0.002) (0.002) NumberOfEmployees 0.000 0.000 0.000 0.000 0.000 0.000 0.000 (0.000) (0.000) (0.000) (0.000) (0.000) (0.000) (0.000) CountryChinaUSI 0.831 *** (0.117) (0.129) (0.132) Competitive Environment -0.082 -0.002 0.032 (0.071) (0.072) (0.060) (0.053) Manufacturing 0.252 -0.239 -0.125 -0.333 -0.142 0.197 0.138 (0.178) (0.311) (0.196) (0.315) (0.200) (0.277) (0.246) Service 0.053 -0.654 * 0.024 -0.178 -0.089 0.047 0.007 (0.148) (0.374) (0.163) (0.378) (0.168) (0.327) (0.290) InfoTech 0.121 -0.290 0.099 -0.869 -0.208 -0.001 0.043 (0.180) (0.375) (0.198) (0.379) (0.209) (0.333) (0.296) Education 0.256 -0.487 -0.015 -0.693 -0.029 -0.066 0.016 (0.258) (0.385) (0.284) (0.389) (0.289) (0.342) (0.304) Electronics 0.011 0.205 -0.395 (0.250) (0.285) (0.280) Medical -0.064 0.179 -0.372 (0.190) (0.209) (0.214) RealEstate -0.227 -0.139 0.378 -0.019 -0.364 0.217 0.037 (0.397) (0.389) (0.438) (0.393) (0.443) (0.338) (0.300) Trade 0.220 -0.443 0.094 -0.658 0.163 0.053 0.001 (0.228) (0.341) (0.251) (0.343) (0.256) (0.300) (0.265) ConsumerGoodsMfg| -0.523 * -0.641 0.110 -0.111 (0.319) (0.322) (0.283) (0.252) OtherMfg RepairInstall -0.067 0.021 0.377 0.329 (0.439) (0.445) (0.391) (0.348) TransportStorage 0.382 -0.437 0.326 0.380 (0.403) (0.408) (0.351) (0.312) Constant 2.156 *** 0.281 -2.230 *** 0.436 2.463 *** -0.073 -0.049 (0.223) (0.300) (0.246) (0.303) (0.252) (0.267) (0.237) Note: coeffieicnt and/or standard errors shown as 0 have near-zero values on the order of 1E-06 or less. *p<.05>


