

Question: 2. An article reports a comparison of several methods for predicting the shear strength for steel plate girders. Data for two of these methods, the
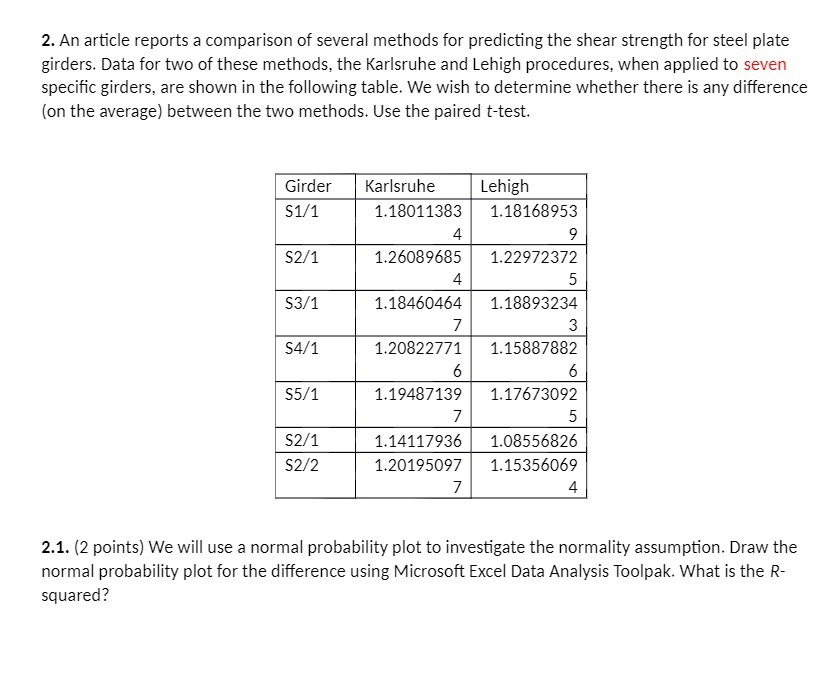

2. An article reports a comparison of several methods for predicting the shear strength for steel plate girders. Data for two of these methods, the Karlsruhe and Lehigh procedures, when applied to seven specic girders, are shown in the following table. We wish to determine whether there is any difference {on the average) between the two methods. Use the paired ttest. 1...... 1 18811383 118168953 4 9 126089685 122922322 4 5 118460464 118893234 2 3 1.208227?1 1.158374%? 6 6 1.1948?139 1.1?6TSD92 3" 5 1.1411?936 1.08556326 1.2019509? 1.15356069 3' 4 2.1. [2 points] We will use a normal probabilityr plot to investigate the normality assumption. Draw the normal probability plot for the difference using Microsoft Excel Data Analysis Toolpak. What is the R squared
Step by Step Solution
There are 3 Steps involved in it

Get step-by-step solutions from verified subject matter experts