

Question: 2. An engineer is designing a battery for use. He has three possible plate materials to use. He is aware that temperature may affect the
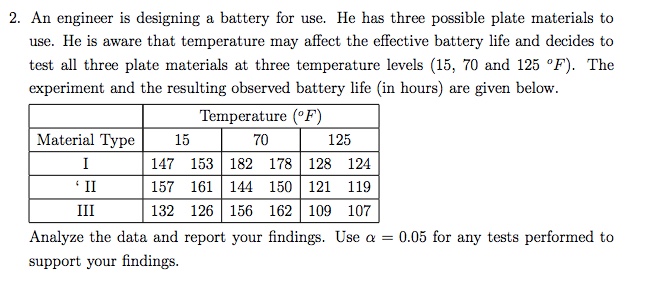
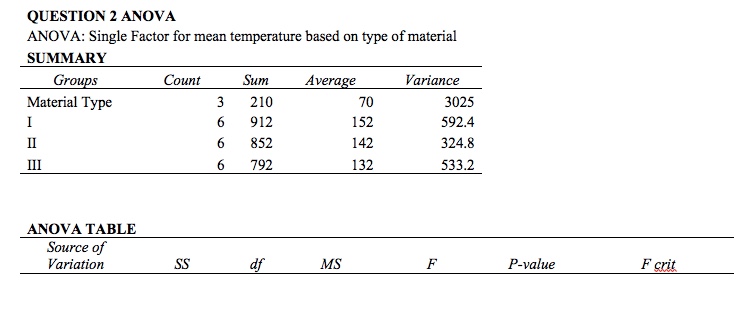
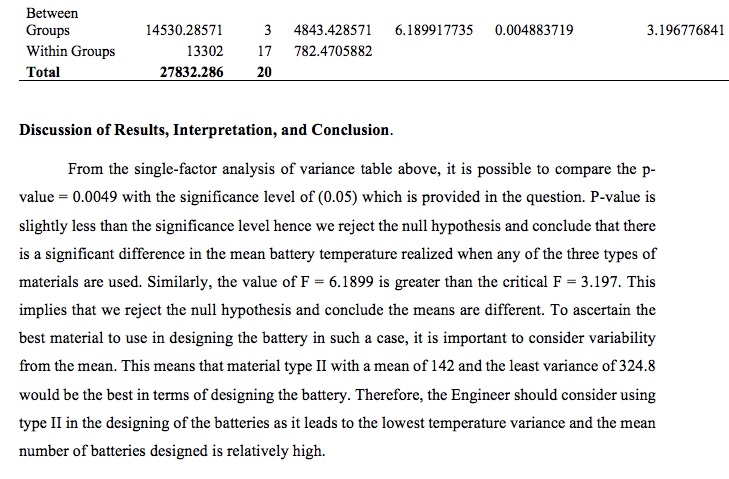
2. An engineer is designing a battery for use. He has three possible plate materials to use. He is aware that temperature may affect the effective battery life and decides to test all three plate materials at three temperature levels (15, 70 and 125 "F). The experiment and the resulting observed battery life (in hours) are given below. Temperature ( F) Material Type 15 70 125 H 147 153 182 178 128 124 * II 157 161 144 150 121 119 III 132 126 156 162 109 107 Analyze the data and report your findings. Use a = 0.05 for any tests performed to support your findings.Question 2: Designing the battery to use by an Engineer In this case, the interest is to test the hypothesis that there is any signicant difference in the mean temperature of the battery based on the type of material used in designing the batter. The analysis is carried out as follows: Data Analysis. This test can be done using the analysis of variance (ANDVA) to test whether there is any signicant difference between the mean temperatures when different types of materials are used in designing the battery. The null and the alternative hypothesis are therefore set as follows: Natl ypathesis Ha: a; = F1 = In; against; Alternative ypnnests Hr.- At least one means temperature for the materials ofpe I, H. and III is different. Where [1.1, :12, and p3 represents the mean temperatures for material type I, [I and 111 respectively. The following is the output table for the analysis of variance on the provided dataset. Table: Single-Factor Analysis of Variance for Mean Temperature of Battery based on the type of material used. QUESTION 2 ANOVA ANOVA: Single Factor for mean temperature based on type of material SUMMARY Groups Count Sum Average Variance Material Type 210 70 3025 912 152 592.4 II 6 852 142 324.8 III 792 132 533.2 ANOVA TABLE Source of Variation SS df MS F P-value F critBetween Groups 14530.28571 3 4843.428571 6.189917735 0.004883719 3.196776841 Within Groups 13302 17 782.4705882 Total 27832.286 20 Discussion of Results, Interpretation, and Conclusion. From the single-factor analysis of variance table above, it is possible to compare the p- value = 0.0049 with the significance level of (0.05) which is provided in the question. P-value is slightly less than the significance level hence we reject the null hypothesis and conclude that there is a significant difference in the mean battery temperature realized when any of the three types of materials are used. Similarly, the value of F = 6.1899 is greater than the critical F = 3.197. This implies that we reject the null hypothesis and conclude the means are different. To ascertain the best material to use in designing the battery in such a case, it is important to consider variability from the mean. This means that material type II with a mean of 142 and the least variance of 324.8 would be the best in terms of designing the battery. Therefore, the Engineer should consider using type II in the designing of the batteries as it leads to the lowest temperature variance and the mean number of batteries designed is relatively high
Step by Step Solution
There are 3 Steps involved in it

Get step-by-step solutions from verified subject matter experts