

Question: 2. Behavioural Finance. Please provide complete and correct solution done on computer or by hand. Please, emphasis on correct solution. This is all the information
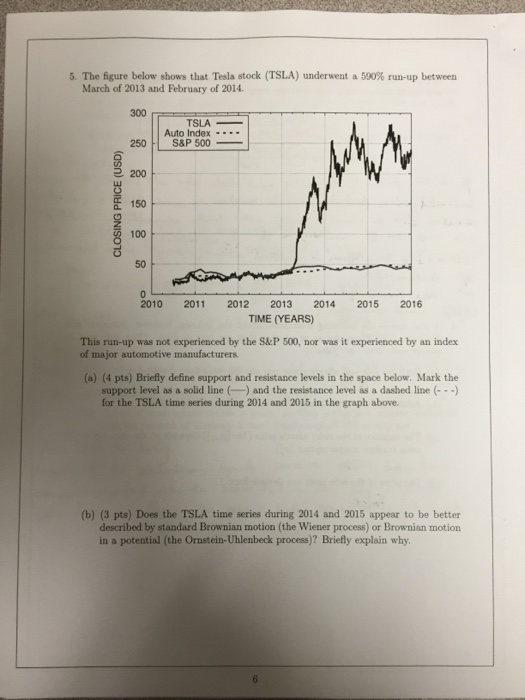
5. The figure below shows that Tesla stock (TSLA) underwent a 500% run-up between March of 2013 and February of 2014 300 TSLA -- Auto Index- S&P 500 250 H 200 a 150 100 50 2010 2011 2012 2013 2014 2015 2016 TIME (YEARS) This run-up was not experienced by the S&P 500, nor was it experienced by an index of major automotive manufacturers (a) (4 pts) Briefly define support and resistance levels in the space below. Mark the support level as a solid line( and the resistance level as a dashed line ( ) for the TSLA time series during 2014 and 2015 in the graph above. (b) (3 pts) Does the TSLA time series during 2014 and 2015 appear to be better described by standard Brownian motion (the Wiener process) or Brownian motion in a potential (the Ornstein-Uhlenbeck process)? Briefly explain why
Step by Step Solution
There are 3 Steps involved in it

Get step-by-step solutions from verified subject matter experts