

Question: 2. Complete the following grid: Store 3 Ner Sales Cast of goods sold Gros margin-dollars Groos margin-percent Expenses---dollars Expenses-percent Net income-dollars Net income-percent Dollars expressed
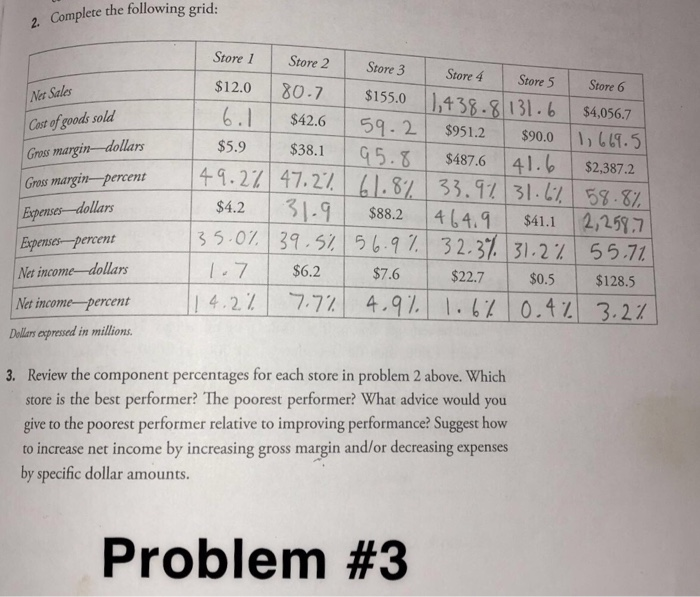
2. Complete the following grid: Store 3 Ner Sales Cast of goods sold Gros margin-dollars Groos margin-percent Expenses---dollars Expenses-percent Net income-dollars Net income-percent Dollars expressed in millions Store 1 Store 2 Store 4 Store 5 Store 6 $12.0 80.7 $155.0 1,438.8.131.6 $4,056.7 6.1 $42. 6 5 9.2 $951.2 $90.0 1,619.5 $5.9 $38.1 65.8 $487.6 41.6 $2,387.2 49.2% 47.2% 61.8% 33.9731.6% 58.8% $4.2 31.9 $88.2 464.9 $41.1 2,259.7 35.0% 39.5% 56.9% 32.3% 31.2% 55.71 1.7 $6.2 $7.6 $22.7 $0.5 $128.5 114.2% 7,7% 4,9% 1.6% 0.4% 3.2% 3. Review the component percentages for each store in problem 2 above. Which store is the best performer? The poorest performer? What advice would you give to the poorest performer relative to improving performance? Suggest how to increase net income by increasing gross margin and/or decreasing expenses by specific dollar amounts. Problem #3
Step by Step Solution
There are 3 Steps involved in it

Get step-by-step solutions from verified subject matter experts