

Question: 2. Consider the builtin data frame pressure. There are two columns temperature and pressure. (a) (b) (d) Construct a scatterplot with pressure on the vertical

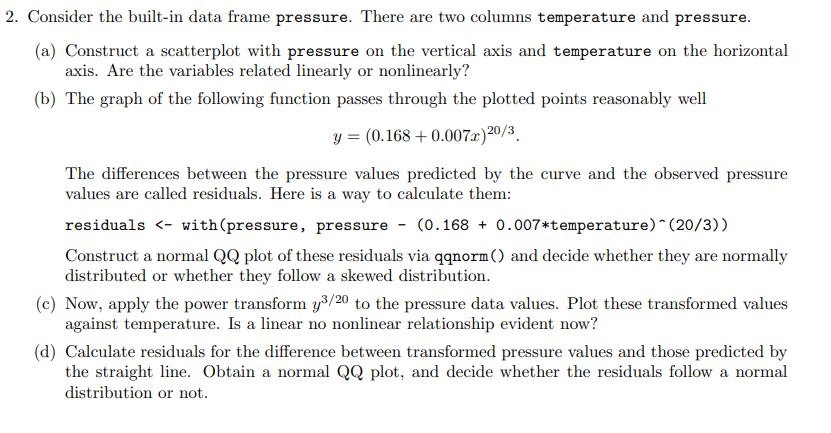
2. Consider the builtin data frame pressure. There are two columns temperature and pressure. (a) (b) (d) Construct a scatterplot with pressure on the vertical axis and temperature on the horizontal axis. Are the variables related linearly or nonlinearly'? The graph of the following function passes through the plotted points reasonablyr well 3; = (0.168 + (1007th The differences between the pressure values predicted by the curve and the observed pressure values are called residuals. Here is a way to calculate them: residuals
Step by Step Solution
There are 3 Steps involved in it
1 Expert Approved Answer
Step: 1 Unlock

Question Has Been Solved by an Expert!
Get step-by-step solutions from verified subject matter experts
Step: 2 Unlock
Step: 3 Unlock