

Question: Using R language. 1. Consider the built-in data frame pressure. (a) Plot pressure against temperature, and use the following command to pass a curve through
Using R language.
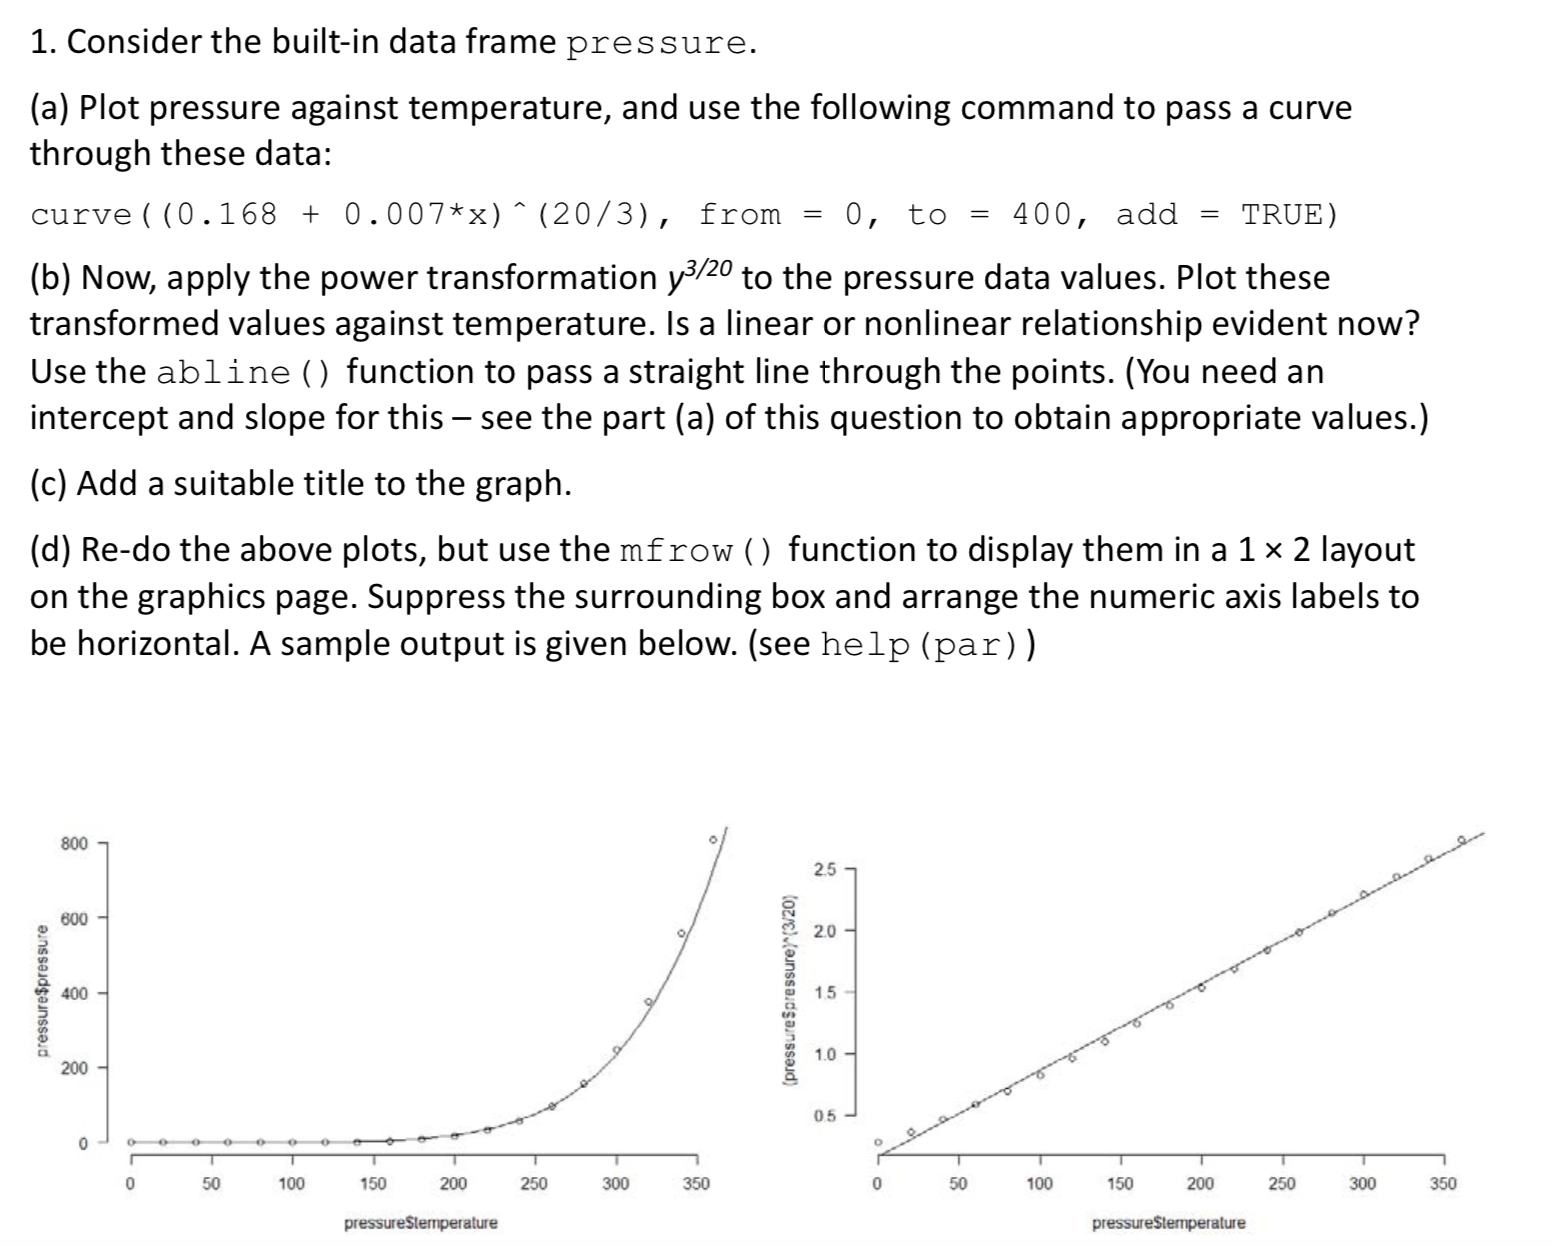
1. Consider the built-in data frame pressure. (a) Plot pressure against temperature, and use the following command to pass a curve through these data: curve ( (0 . 168 + 0 . 007*x) ~ (20/3) , from = 0, to = 400, add = TRUE) (b) Now, apply the power transformation y3/20 to the pressure data values. Plot these transformed values against temperature. Is a linear or nonlinear relationship evident now? Use the abline () function to pass a straight line through the points. (You need an intercept and slope for this - see the part (a) of this question to obtain appropriate values.) (c) Add a suitable title to the graph. (d) Re-do the above plots, but use the mfrow ( ) function to display them in a 1 x 2 layout on the graphics page. Suppress the surrounding box and arrange the numeric axis labels to be horizontal. A sample output is given below. (see help (par) ) 800 2.5 - pressure$pressure 600 (pressure Spressure)*(3/20) 2.0 - 400 15 200 1.0 - 05 - 50 100 150 200 250 300 350 50 100 150 200 250 300 350 pressureStemperature pressurestemperature
Step by Step Solution
There are 3 Steps involved in it

Get step-by-step solutions from verified subject matter experts