

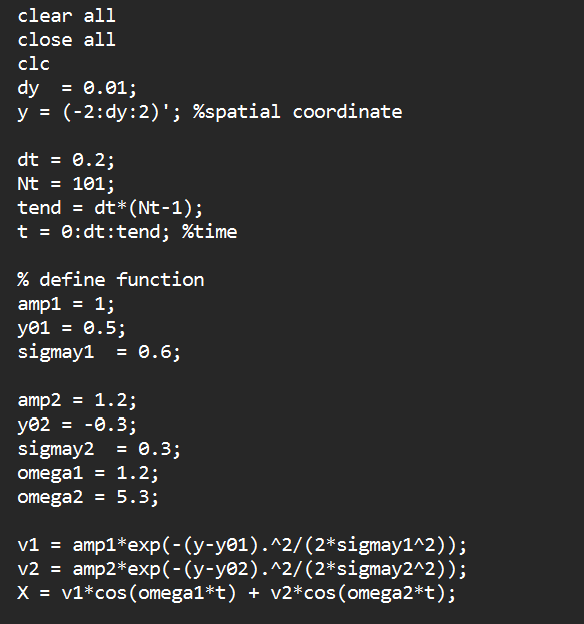
Question: 2 . Consider the data generated by the le hw 2 Q 2 . m ( in Matlab ) , which is assembled into the
Consider the data generated by the le hwQm in Matlab which is assembled into the matrix X Compute the SVD of X and plot the first two left singular vectors against y the spatial coordinate Why are the first two singular values much larger than the rest which are essentially
zero
Change the function that generates the data in question so that the spatial peaks ie the Gaussians change their location with time. How you do this is up to you, so this question is a bit open ended. How does this change the
results of question You may also change the amount of data in space andor time if you wish to clear all
close all
dy ;
dy: ; spatial coordinate
;
;
tend ;
:: tend; time
define function
amp;
ye;
sigmay;
amp;
;
sigmay;
omega;
omega;
sigmay
Step by Step Solution
There are 3 Steps involved in it
1 Expert Approved Answer
Step: 1 Unlock

Question Has Been Solved by an Expert!
Get step-by-step solutions from verified subject matter experts
Step: 2 Unlock
Step: 3 Unlock