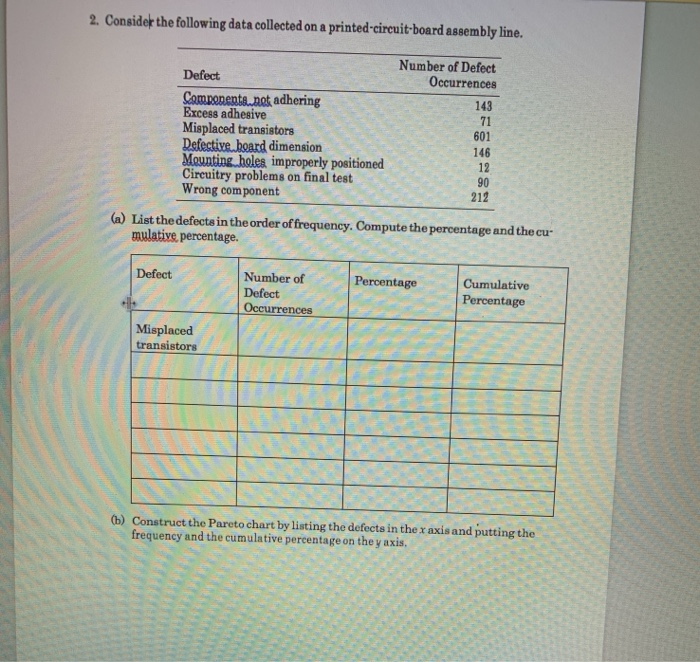
Question: 2. Consider the following data collected on a printed circuit board assembly line. Number of Defect Occurrences 143 71 Defect Componenta.net adhering Excess adhesive Misplaced

2. Consider the following data collected on a
2. Consider the following data collected on a printed circuit board assembly line. Number of Defect Occurrences 143 71 Defect Componenta.net adhering Excess adhesive Misplaced transistors Defestive, board dimension Mounting holes improperly positioned Circuitry problems on final test Wrong component 601 146 90 212 (a) List the defects in the order of frequency. Compute the percentage and the cu mulative percentage. Defect Percentage Number of Defect Occurrences C umulative Percentage Maplaced Misplaced transistors (b) Construct the Pareto chart by listing the defects in the xaxis and putting the frequency and the cumulative percentage on the yaxis. 3. A list of 12 issues that led to incorrect formulations in Tuncey Bayrak's jam manufac- turing unit in New England is provided below. List of Issues 1. Antiquated scales 6. Equipment in disrepair 2. Lack of clear instructions 7. Technician calculation off 3. Damaged raw material 8. Jars mislabeled 4. Operator misreads display 9. Temperature controls off 5. Variability in scale accuracy 10. Priority miscommunication Create a fish-bone diagram and categorize each of these issues under Materials, Meth ods, Manpower, or Machinery. Materials Methods Incorrect Formulations Manpower Machinery

Step by Step Solution

There are 3 Steps involved in it

1 Expert Approved Answer
Step: 1 Unlock blur-text-image
Question Has Been Solved by an Expert!

Get step-by-step solutions from verified subject matter experts

Step: 2 Unlock
Step: 3 Unlock

Students Have Also Explored These Related General Management Questions!