

Question: 2. Consider the following histogram. (8 points) 4+ 200 400 600 800 1000 1200 a. Construct frequency distribution corresponding to the histogram. b. Construct
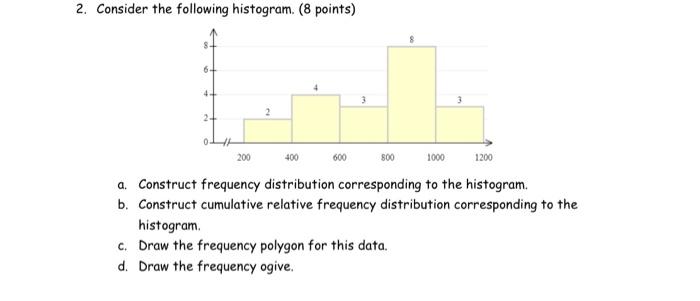
2. Consider the following histogram. (8 points) 4+ 200 400 600 800 1000 1200 a. Construct frequency distribution corresponding to the histogram. b. Construct cumulative relative frequency distribution corresponding to the histogram. c. Draw the frequency polygon for this data. d. Draw the frequency ogive.
Step by Step Solution
★★★★★
3.41 Rating (151 Votes )
There are 3 Steps involved in it
1 Expert Approved Answer
Step: 1 Unlock

Question Has Been Solved by an Expert!
Get step-by-step solutions from verified subject matter experts
Step: 2 Unlock
Step: 3 Unlock