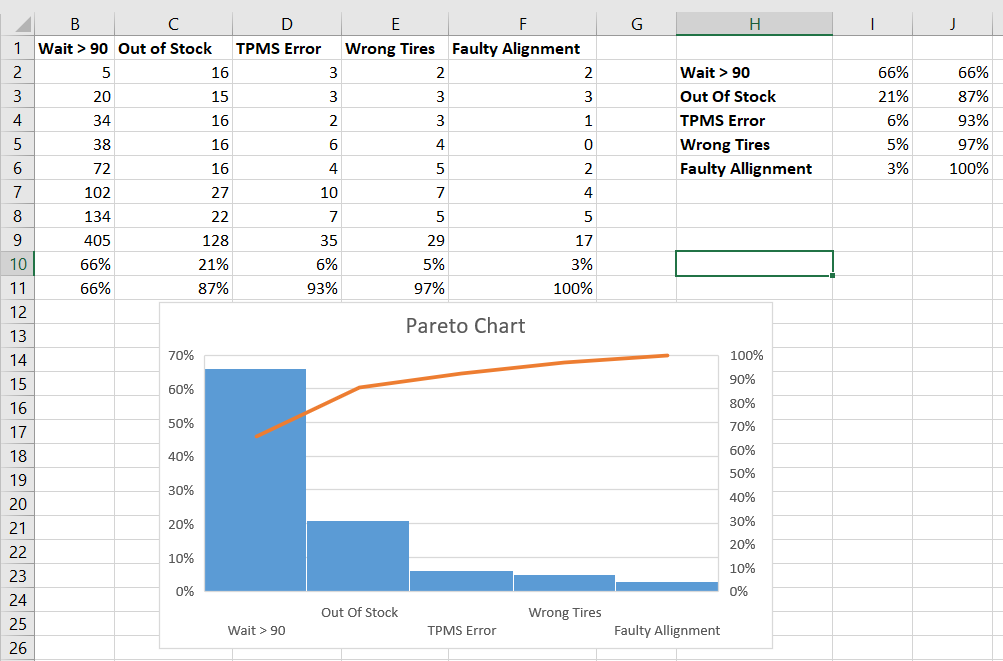
Question: 2. Consider the Pareto chart (Below). Based on the results of this chart, do you believe that the 80/20 rule applies? Why or why not?

2. Consider the Pareto chart (Below). Based on the results of this chart, do you believe that the 80/20 rule applies? Why or why not? Using the chart, identify the quality problem that management should address first, and justify your answer.

2. Consider the Pareto chart (Below). Based on

G H I J Wait > 90 66% Out Of Stock TPMS Error Wrong Tires Faulty Allignment 66% 21% 6% 5% 3% 87% 93% 97% 100% 21% B E F 1 Wait > 90 Out of Stock TPMS Error Wrong Tires Faulty Alignment 2 5 16 3 2 3 20 15 3 3 3 4 34 16 2 3 1 5 38 16 6 4 0 6 72 16 4 5 2 7 102 27 10 7 4 8 134 22 7 5 5 9 405 128 35 29 17 10 66% 6% 5% 3% 11 66% 87% 93% 97% 100% 12 Pareto Chart 13 14 70% 15 60% 16 50% 17 18 40% 19 30% 20 21 22 10% 23 0% 24 Out of Stock Wrong Tires 25 Wait > 90 TPMS Error 26 100% 90% 80% 70% 60% 50% 40% 20% 30% 20% 10% 0% Faulty Allignment

Step by Step Solution

There are 3 Steps involved in it

1 Expert Approved Answer
Step: 1 Unlock blur-text-image
Question Has Been Solved by an Expert!

Get step-by-step solutions from verified subject matter experts

Step: 2 Unlock
Step: 3 Unlock

Students Have Also Explored These Related General Management Questions!