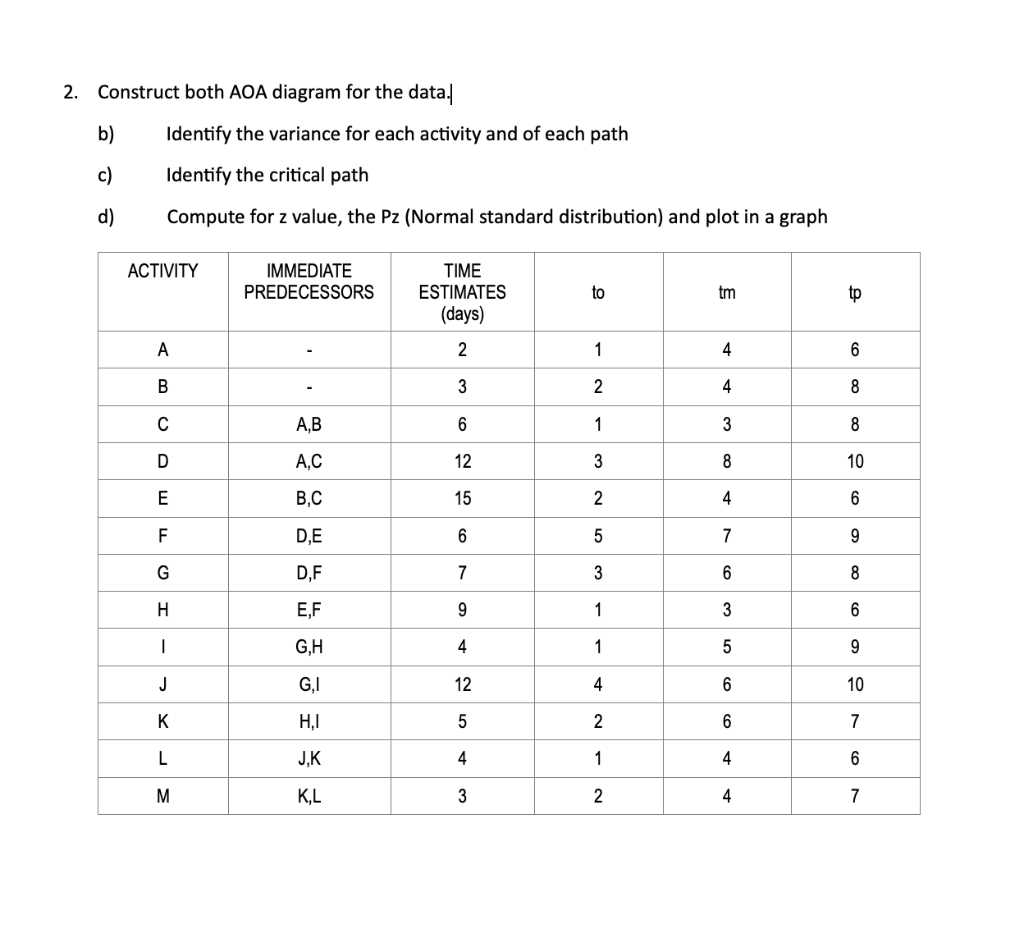
Question: 2. Construct both AOA diagram for the data. b) Identify the variance for each activity and of each path c) Identify the critical path d)

2. Construct both AOA diagram for the data. b)

2. Construct both AOA diagram for the data. b) Identify the variance for each activity and of each path c) Identify the critical path d) Compute for z value, the Pz (Normal standard distribution) and plot in a graph ACTIVITY IMMEDIATE PREDECESSORS TIME ESTIMATES (days) to tm tp A 1 4 6 B 3 2 4 8 A,B 6 WN 1 3 8 D AC 12 3 8 10 E B,C 15 2 4 6 F DE 5 7 9 G DF 7 3 6 8 . E,F 9 1 3 6 1 GH 4 1 5 9 J GI 12 4 6 10 K HI 5 2 6 7 L JK 1 4 6 M KL 3 2 4 7

Step by Step Solution

There are 3 Steps involved in it

1 Expert Approved Answer
Step: 1 Unlock blur-text-image
Question Has Been Solved by an Expert!

Get step-by-step solutions from verified subject matter experts

Step: 2 Unlock
Step: 3 Unlock

Students Have Also Explored These Related General Management Questions!