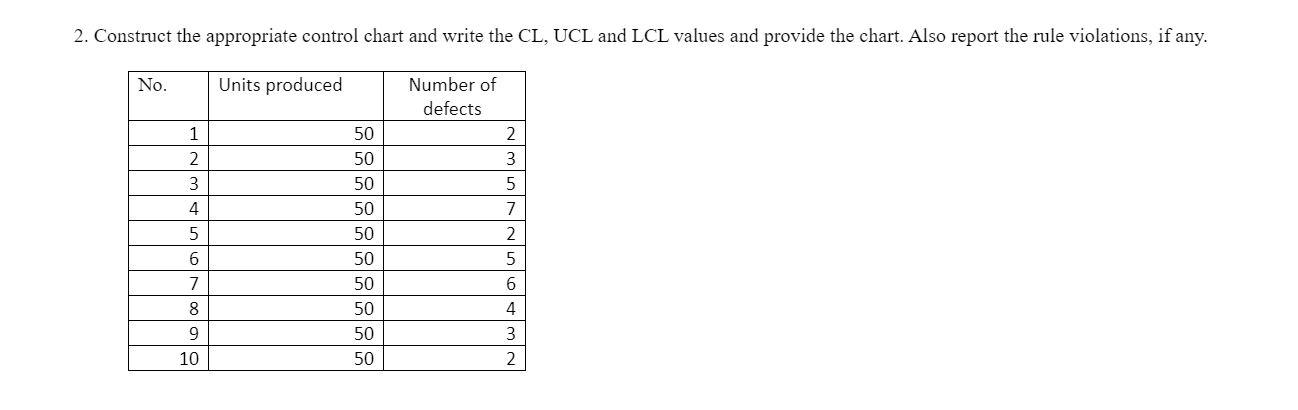
Question: 2. Construct the appropriate control chart and write the CL, UCL and LCL values and provide the chart. Also report the rule violations, if any.

2. Construct the appropriate control chart and

2. Construct the appropriate control chart and write the CL, UCL and LCL values and provide the chart. Also report the rule violations, if any. No. Units produced Number of defects 50 1 2 50 3 50 2 3 5 7 2 4 50 50 5 6 50 5 7 50 6 8 50 4 9 50 3 2 10 50 2. Construct the appropriate control chart and write the CL, UCL and LCL values and provide the chart. Also report the rule violations, if any. No. Units produced Number of defects 50 1 2 50 3 50 2 3 5 7 2 4 50 50 5 6 50 5 7 50 6 8 50 4 9 50 3 2 10 50

Step by Step Solution

There are 3 Steps involved in it

1 Expert Approved Answer
Step: 1 Unlock blur-text-image
Question Has Been Solved by an Expert!

Get step-by-step solutions from verified subject matter experts

Step: 2 Unlock
Step: 3 Unlock

Students Have Also Explored These Related General Management Questions!