

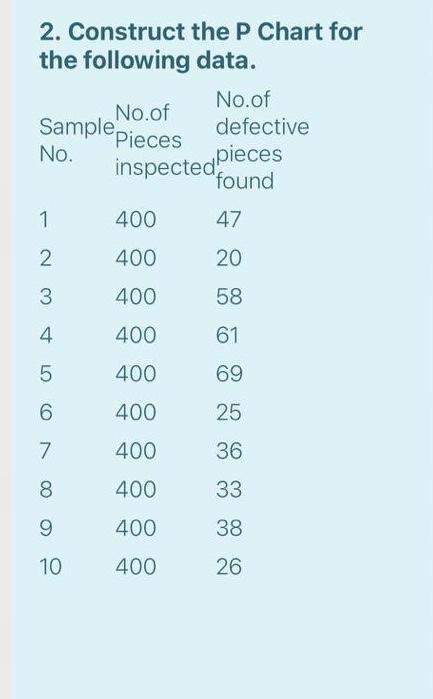
Question: 2. Construct the P Chart for the following data. No.of No.of Sample defective Pieces No. 'found inspectedpieces 1 400 47 2 400 20 3 400
Step by Step Solution
There are 3 Steps involved in it
1 Expert Approved Answer
Step: 1 Unlock

Question Has Been Solved by an Expert!
Get step-by-step solutions from verified subject matter experts
Step: 2 Unlock
Step: 3 Unlock