

Question: 2 . Cournot competition pls try to do the graph also Consider a town in which only two residents, Raphael and Susan, own wells that
Cournot competition
pls try to do the graph also
Consider a town in which only two residents, Raphael and Susan, own wells that produce water safe for drinking. Raphael and Susan can pump and sell as much water as they want at no cost Assume that outside water cannot be transported into the town for sale. The following questions will walk you through how to compute the Cournot quantity competition outcome for these duopolists.
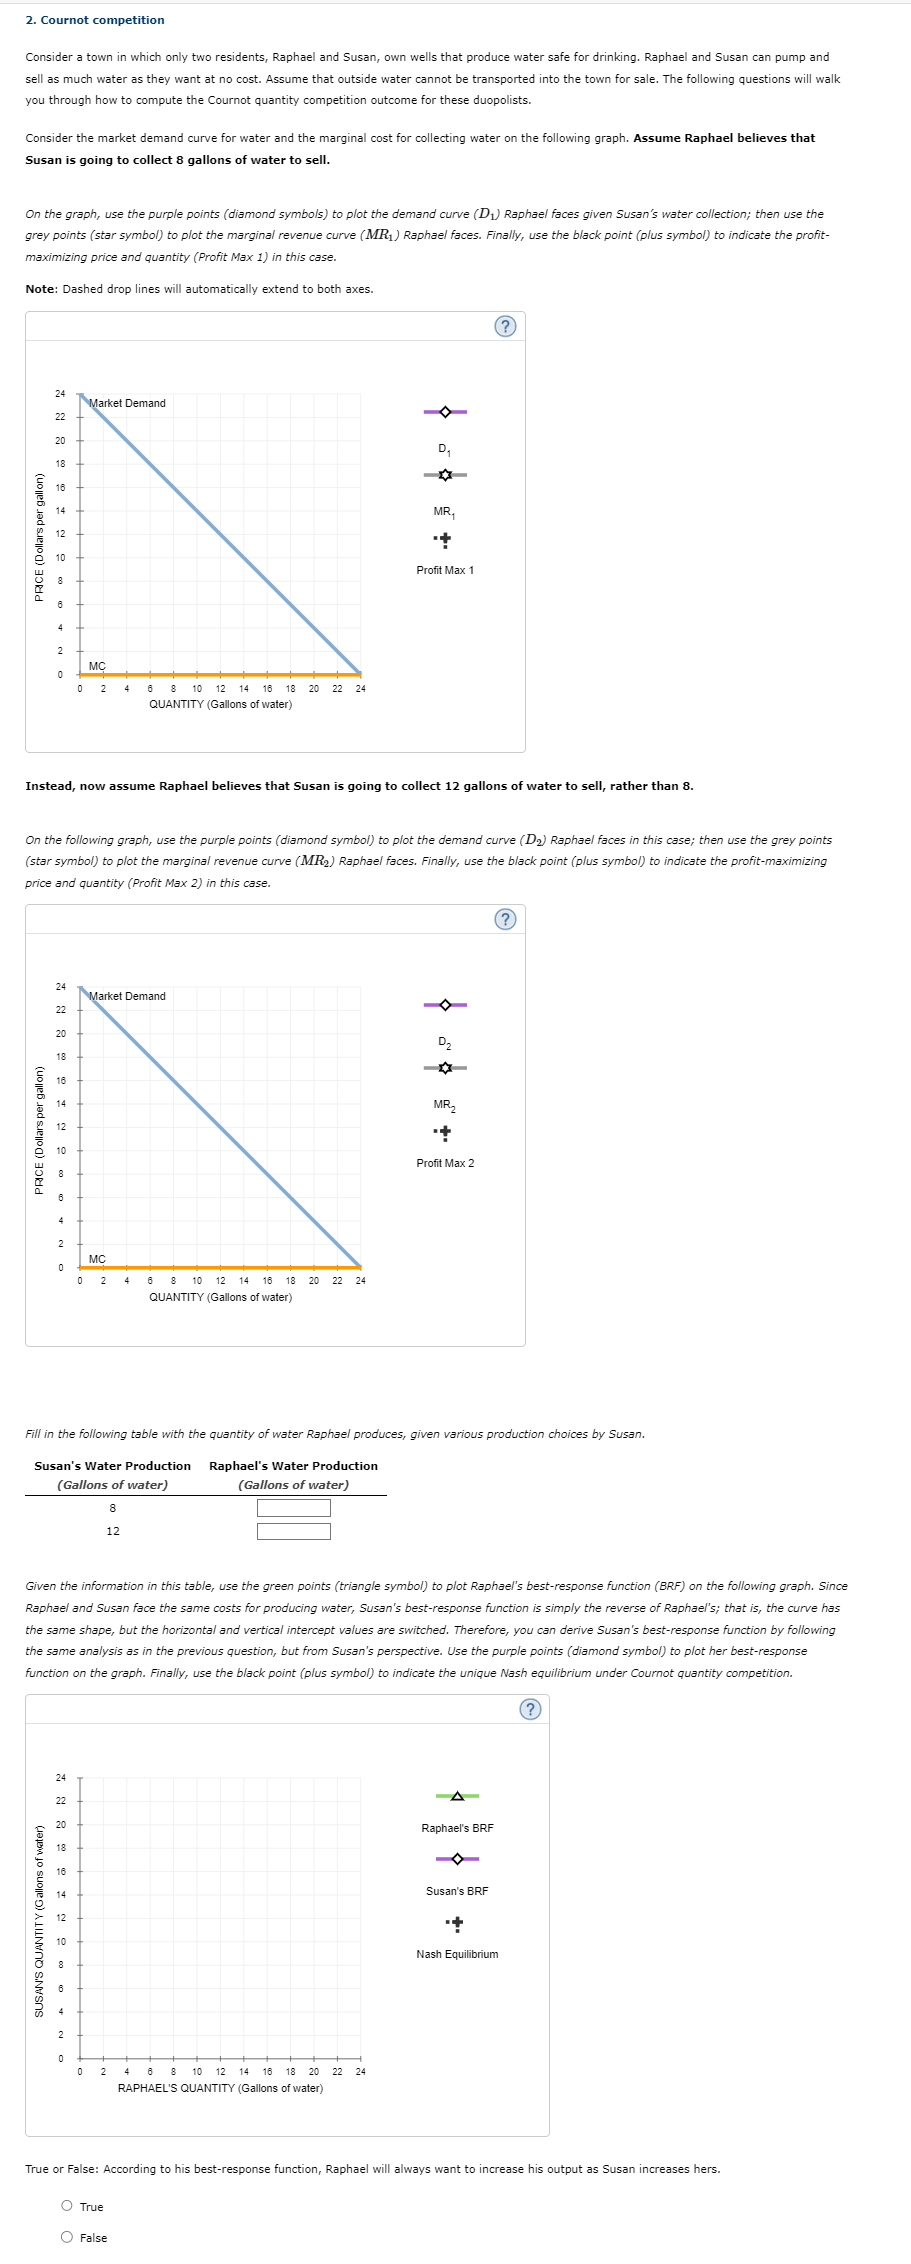
Consider the market demand curve for water and the marginal cost for collecting water on the following graph. Assume Raphael believes that Susan is going to collect mathbf gallons of water to sell.
On the graph, use the purple points diamond symbols to plot the demand curve D Raphael faces given Susan's water collection; then use the grey points star symbol to plot the marginal revenue curve M R Raphael faces. Finally, use the black point plus symbol to indicate the profitmaximizing price and quantity Profit Max in this case.
Note: Dashed drop lines will automatically extend to both axes.
Instead, now assume Raphael believes that Susan is going to collect mathbf gallons of water to sell, rather than mathbf
On the following graph, use the purple points diamond symbol to plot the demand curve D Raphael faces in this case; then use the grey points star symbol to plot the marginal revenue curve M R Raphael faces. Finally, use the black point plus symbol to indicate the profitmaximizing price and quantity Profit Max in this case.
Fill in the following table with the quantity of water Raphael produces, given various production choices by Susan.
Given the information in this table, use the green points triangle symbol to plot Raphael's bestresponse function BRF on the following graph. Since Raphael and Susan face the same costs for producing water, Susan's bestresponse function is simply the reverse of Raphael's; that is the curve has the same shape, but the horizontal and vertical intercept values are switched. Therefore, you can derive Susan's bestresponse function by following the same analysis as in the previous question, but from Susan's perspective. Use the purple points diamond symbol to plot her bestresponse function on the graph. Finally, use the black point plus symbol to indicate the unique Nash equilibrium under Cournot quantity competition.TrueFalse
Step by Step Solution
There are 3 Steps involved in it
1 Expert Approved Answer
Step: 1 Unlock

Question Has Been Solved by an Expert!
Get step-by-step solutions from verified subject matter experts
Step: 2 Unlock
Step: 3 Unlock