

Question: 2. Create a Cause and Effect diagram. a. Identify one Effect. This is your Dependent Variable. This should be what you believe if affected. b.
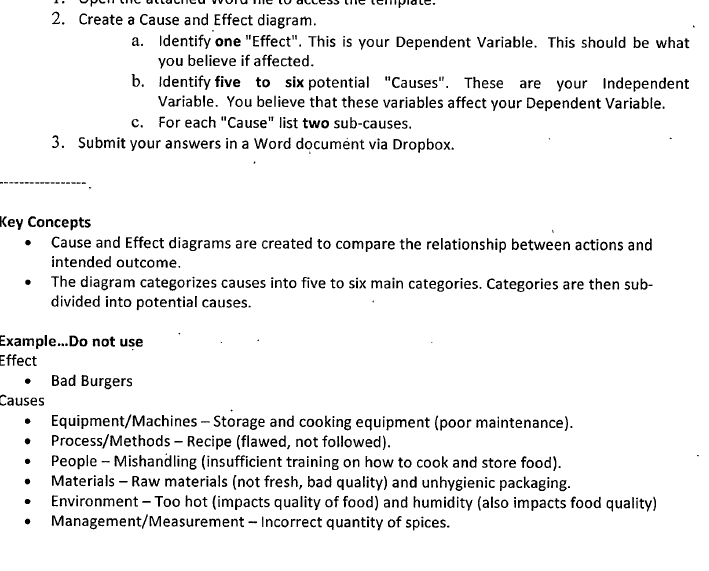
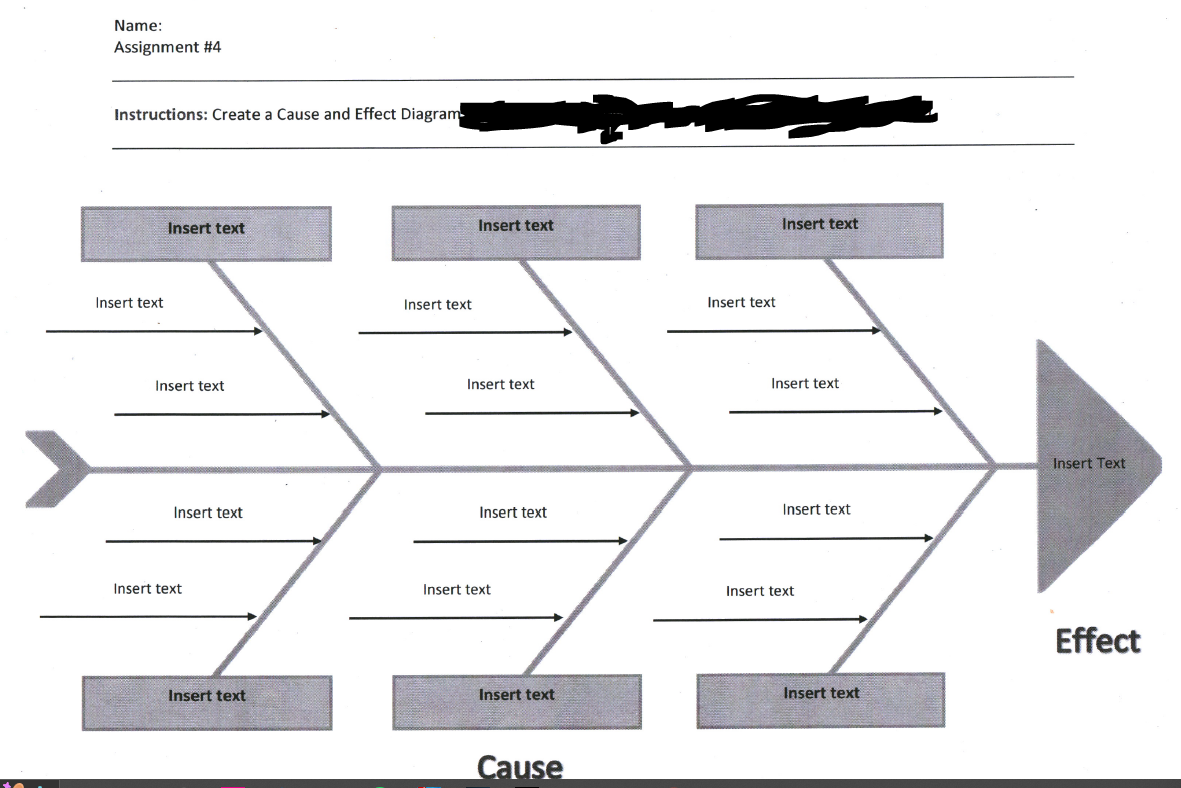
2. Create a Cause and Effect diagram. a. Identify one "Effect". This is your Dependent Variable. This should be what you believe if affected. b. Identify five to six potential "Causes". These are your Independent Variable. You believe that these variables affect your Dependent Variable. C. For each "Cause" list two sub-causes. 3. Submit your answers in a Word document via Dropbox. Key Concepts . Cause and Effect diagrams are created to compare the relationship between actions and intended outcome. The diagram categorizes causes into five to six main categories. Categories are then sub- divided into potential causes. Example...Do not use Effect Bad Burgers Causes Equipment/Machines - Storage and cooking equipment (poor maintenance). Process/Methods - Recipe (flawed, not followed). People - Mishandling (insufficient training on how to cook and store food). Materials - Raw materials (not fresh, bad quality) and unhygienic packaging. Environment - Too hot (impacts quality of food) and humidity (also impacts food quality) Management/Measurement - Incorrect quantity of spices.Name: Assignment #4 Instructions: Create a Cause and Effect Diagram Insert text Insert text Insert text Insert text Insert text Insert text Insert text Insert text Insert text Insert Text Insert text Insert text Insert text Insert text Insert text Insert text Effect Insert text Insert text Insert text Cause
Step by Step Solution
There are 3 Steps involved in it

Get step-by-step solutions from verified subject matter experts