

Question: 2 . Create a sheet titled PG . First, without the use of functions average ( ) and stdev ( ) , compute the average
Create a sheet titled PG First, without the use of functions average and stdev compute
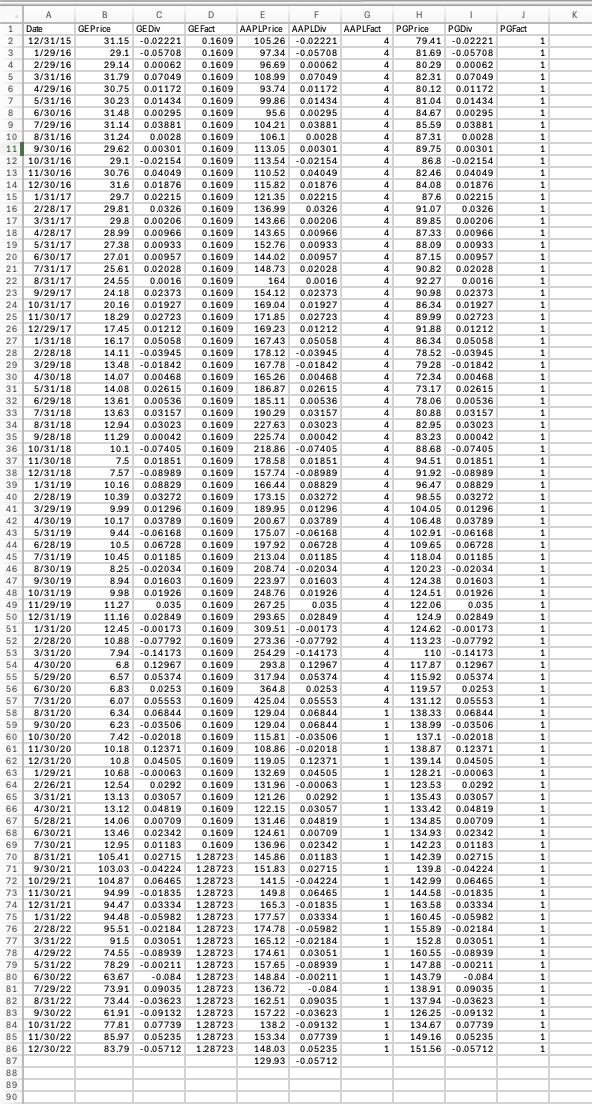
the average and the std deviation of PGs returns. Copy the dates and PG returns from
ReturnData into the sheet, sum the return column and divide by the number of observations
to get the mean Ravg. Create a column with Rt Ravg sum it divide by the number of
observations minus one take a square root sqrt of the result to get the st deviation.
Verify next to it that the Excel functions average and stdev give identical answers.
Create a sheet PortfolioReturnslike ReturnData in which you generate returns on
portfolios with the follwng respective weights for the three stocks:
For example, means that you put in GE in AAPL
and in PG Prepend a column of dates and three columns of individual stock returns.
Append a column with Index returns. You end up with columns: Date, the three stocks,
the portfolios labeled PP and Index. Dates Jan to Dec ie rows. At the
bottom of each return column compute the mean and the st dev. of monthly returns using
functions AVERAGE and STDEV Note: Enter not
Create a sheet Frontier Copy the results from into a transposed rows x cols table.
Columns are: portfolio label, stdev, mean. Rows are the assets. Create an efficient frontier
graph with mean on the Yaxis and st deviation on the Xaxis. Use XY Scatter from the
graph menu. Each portfolio should be represented by a labeled dot. Draw a rough guess of
the Eff Frontier using the Draw ToolShapes Add the risk free TBill rate of
and add the rough guess of the Capital Market Line which goes through point and
is tangent to the efficient frontier eyeball roughly, dont try to be exact You can do this last
part CML also by handie using the draw tool.
a Create a sheet Regressions Copy the date column from ReturnData into Col A
From the FallTBills.xlsx file copy Tbill rates for the correct months match
months only switch dates order to match, divide by to convert annual to
monthly and to reformat to Place the result in Col B Add cols CF in which
you compute the excess returns on the three stocks and Index minus the TBill rates.
b Create a sheet Beta Repeatedly times use the regression function in Excel to
compute betas for the three stocks. Regression can be found in Excel under Data
Data Analysis; scroll to Regression. If it doesnt appear, go to Office icon Excel
options Addins, and add the Analysis Tool pack. Use a DESB computer if your
home one lacks this function. In the regression window, Yvariable is the column
range of stock excess returns, the Xvariable is always the column range of excess
MKT Index returns. Beta will be the slope coefficient in the output range. It will be
labeled XVariable if you dont include header row In ReturnData add a row
labeled Beta at the bottom. Copy the tree betas. Add the market beta for Index
think a little: Compute the betas for the portfolios by weighting the stock betas.
a Create a sheet SML Copy the betas from Partb into a column. Copy the
corresponding return means from Part into another column. Append a row in the table
for TBill with its mean and beta Prepend a col of labels.
b Create two new sheets. As in Part and create rows of monthly price data for GE
AAPL and PG from Dec to Dec into a new sheet NewPriceData Compute
rows of returns from Jan to Dec prices returns for the four securities
GE AAPL, PG Index in NewReturnData Add columns for Portfolios and
compute their returns. As before, at the bottom of the NewReturnData compute the means
and st deviations for the four securities and the portfolios.
c Overwrite the old means for the stocks, the MKT and the portfolios in the SML sheet
with the new means. We have the betas predicted by the data, but the realized
mean returns for Also copyoverwrite the TBills mean with
d Plot the new mean returns against old betas on a graph using XY Scatter with Yaxis
as the mean and Xaxis as beta. Label your stocks and portfolios. Use the Draw tool to trace
the Security Market Line through TBill and Index.
Step by Step Solution
There are 3 Steps involved in it
1 Expert Approved Answer
Step: 1 Unlock

Question Has Been Solved by an Expert!
Get step-by-step solutions from verified subject matter experts
Step: 2 Unlock
Step: 3 Unlock