

Question: 2. Data collected on the yearly registration for a Six Sigma seminar at the Quality College ate shown in the following table: a) Develop a
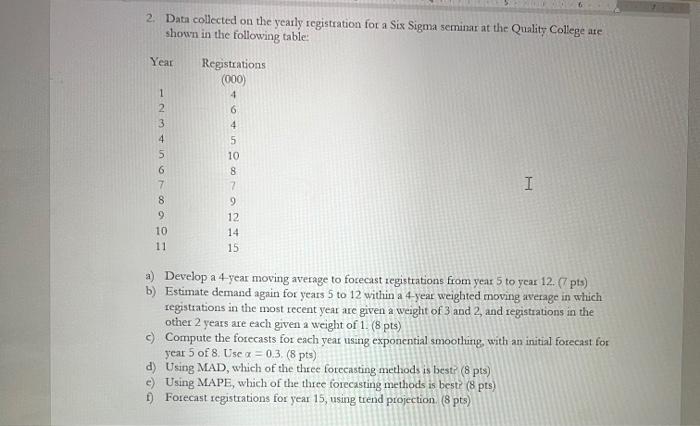
2. Data collected on the yearly registration for a Six Sigma seminar at the Quality College ate shown in the following table: a) Develop a 4 year moving average to forecast iegistrations from year 5 to ycar 12 . (7 pts) b) Estimate demand again for years 5 to 12 within a 4 -year weighted moving average in which registrations in the most recent year are given a weight of 3 and 2 , and registrations in the other 2 years are each given a weight of 1 . ( 8pts) c) Compute the forecasts for each year using exponential smoothing, with an initial forecast for year 5 of 8. Use =0.3. ( 8 pts) d) Using MAD, which of the three forecasting methods is best? ( 8 pts) e) Using MAPE, which of the three forecasting methods is best? (8 pts) f) Forecast registrations for year 15 , using trend projection. ( 8pts )
Step by Step Solution
There are 3 Steps involved in it

Get step-by-step solutions from verified subject matter experts