

Question: Data collected on the yearly registration for a six Sigma seminar at the quality college are shown in the following table. 5. Develop a three-year
Data collected on the yearly registration for a six Sigma seminar at the quality college are shown in the following table.
5. Develop a three-year moving average to forecast years for 4-12
6. develop a three-year weighted, moving average to four cashiers for 4-12using the weight of 0.25 0.25 and 0.5.
7. Use exponential smoothing with an alpha value of 0.3 in a forecast value for year 1 of 5 (5000) find the forecast values for all years, including 12
8. what is the mad for each of the forecast methods?
9. what is the MSE?
Please help with all. 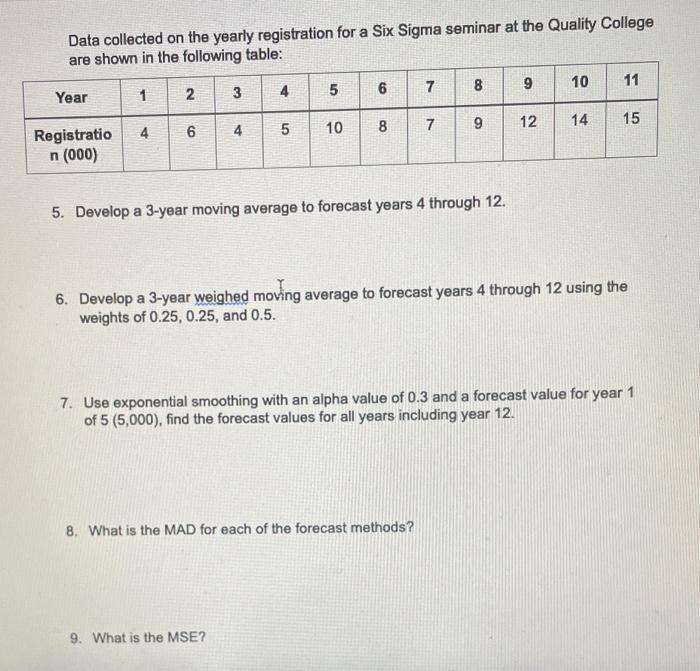
Data collected on the yearly registration for a Six Sigma seminar at the Quality College are shown in the following table: 5. Develop a 3-year moving average to forecast years 4 through 12. 6. Develop a 3-year weighed moving average to forecast years 4 through 12 using the weights of 0.25,0.25, and 0.5. 7. Use exponential smoothing with an alpha value of 0.3 and a forecast value for year 1 of 5(5,000), find the forecast values for all years including year 12 . 8. What is the MAD for each of the forecast methods? 9. What is the MSE
Step by Step Solution
There are 3 Steps involved in it
1 Expert Approved Answer
Step: 1 Unlock

Question Has Been Solved by an Expert!
Get step-by-step solutions from verified subject matter experts
Step: 2 Unlock
Step: 3 Unlock