

Question: 2. Data in the table below show the results from measuring process temperature with an old and a new temperature sensor. All sample temperatures were
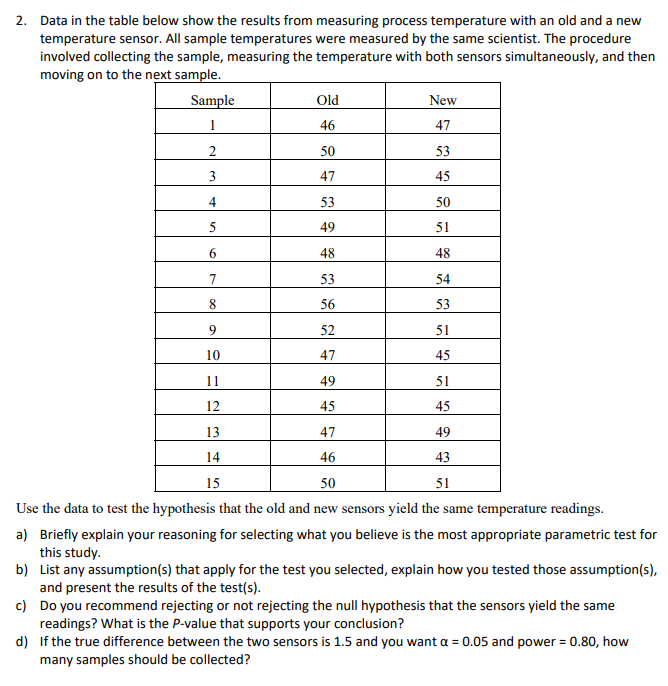
2. Data in the table below show the results from measuring process temperature with an old and a new temperature sensor. All sample temperatures were measured by the same scientist. The procedure involved collecting the sample, measuring the temperature with both sensors simultaneously, and then moving on to the next sam - le. Use the data to test the hypothesis that the old and new sensors yield the same temperature readings. at Briey explain your reasoning for selecting what you believe is the most appropriate parametric test for this study. h} List anyr assumption[s] that apply for the test you selected, explain how you tested those assumption[s], and present the results of the testis]. c] Do you recommend rejecting or not rejecting the null hypothesis that the sensors yield the same readings? What is the Pvalue that supports your conclusion? d} Ifthe true difference between the two sensors is 1.5 and you want ct = [1.05 and power = Emaily how many samples should be collected
Step by Step Solution
There are 3 Steps involved in it

Get step-by-step solutions from verified subject matter experts