

Question: QUESTION 1 [19] - GA2 (19 Calculations). A gauge repeatability and reproducibility study at Frankford Brake Systems collected the data found in the tables below.
![QUESTION 1 [19] - GA2 (19 Calculations). A gauge repeatability and](https://dsd5zvtm8ll6.cloudfront.net/si.experts.images/questions/2024/09/66f939ed1b2d4_32466f939ec92009.jpg)
![these data. The part specification is 1.00.06mm. (19) QUESTION 2 [30.5] -](https://dsd5zvtm8ll6.cloudfront.net/si.experts.images/questions/2024/09/66f939ef61906_32666f939eed5784.jpg)
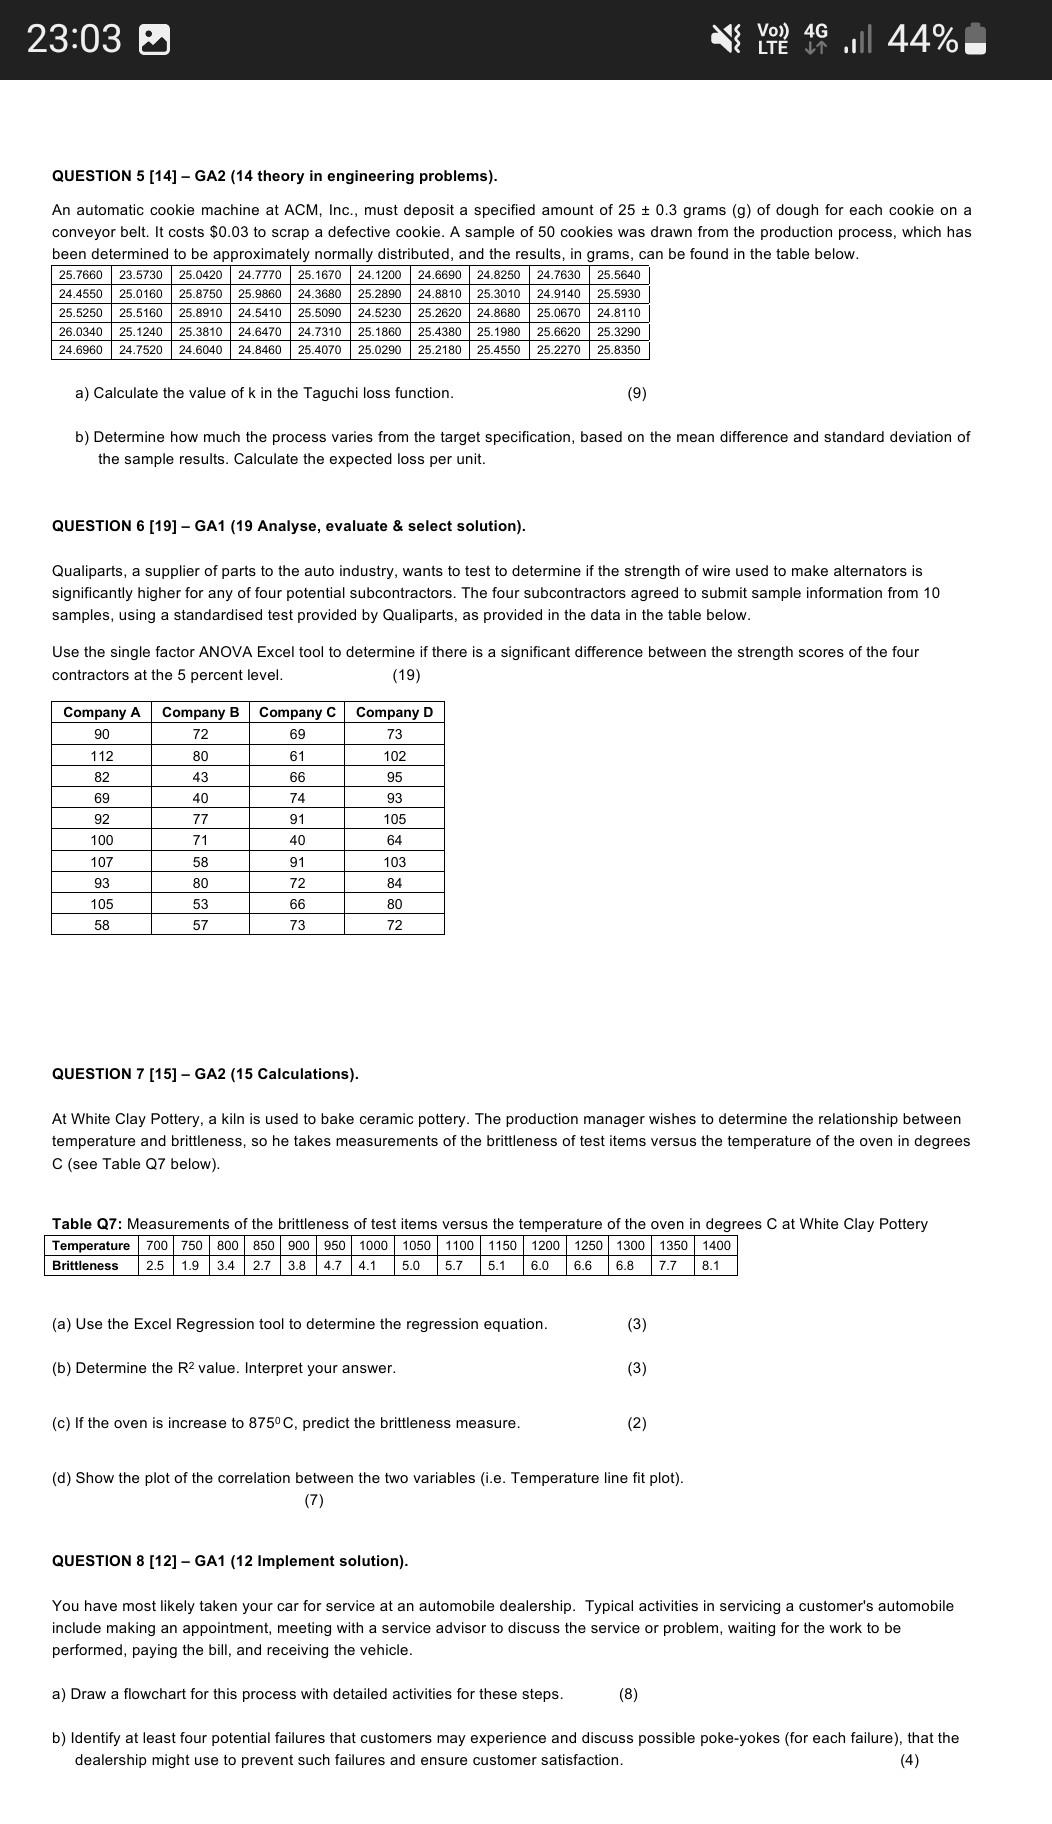
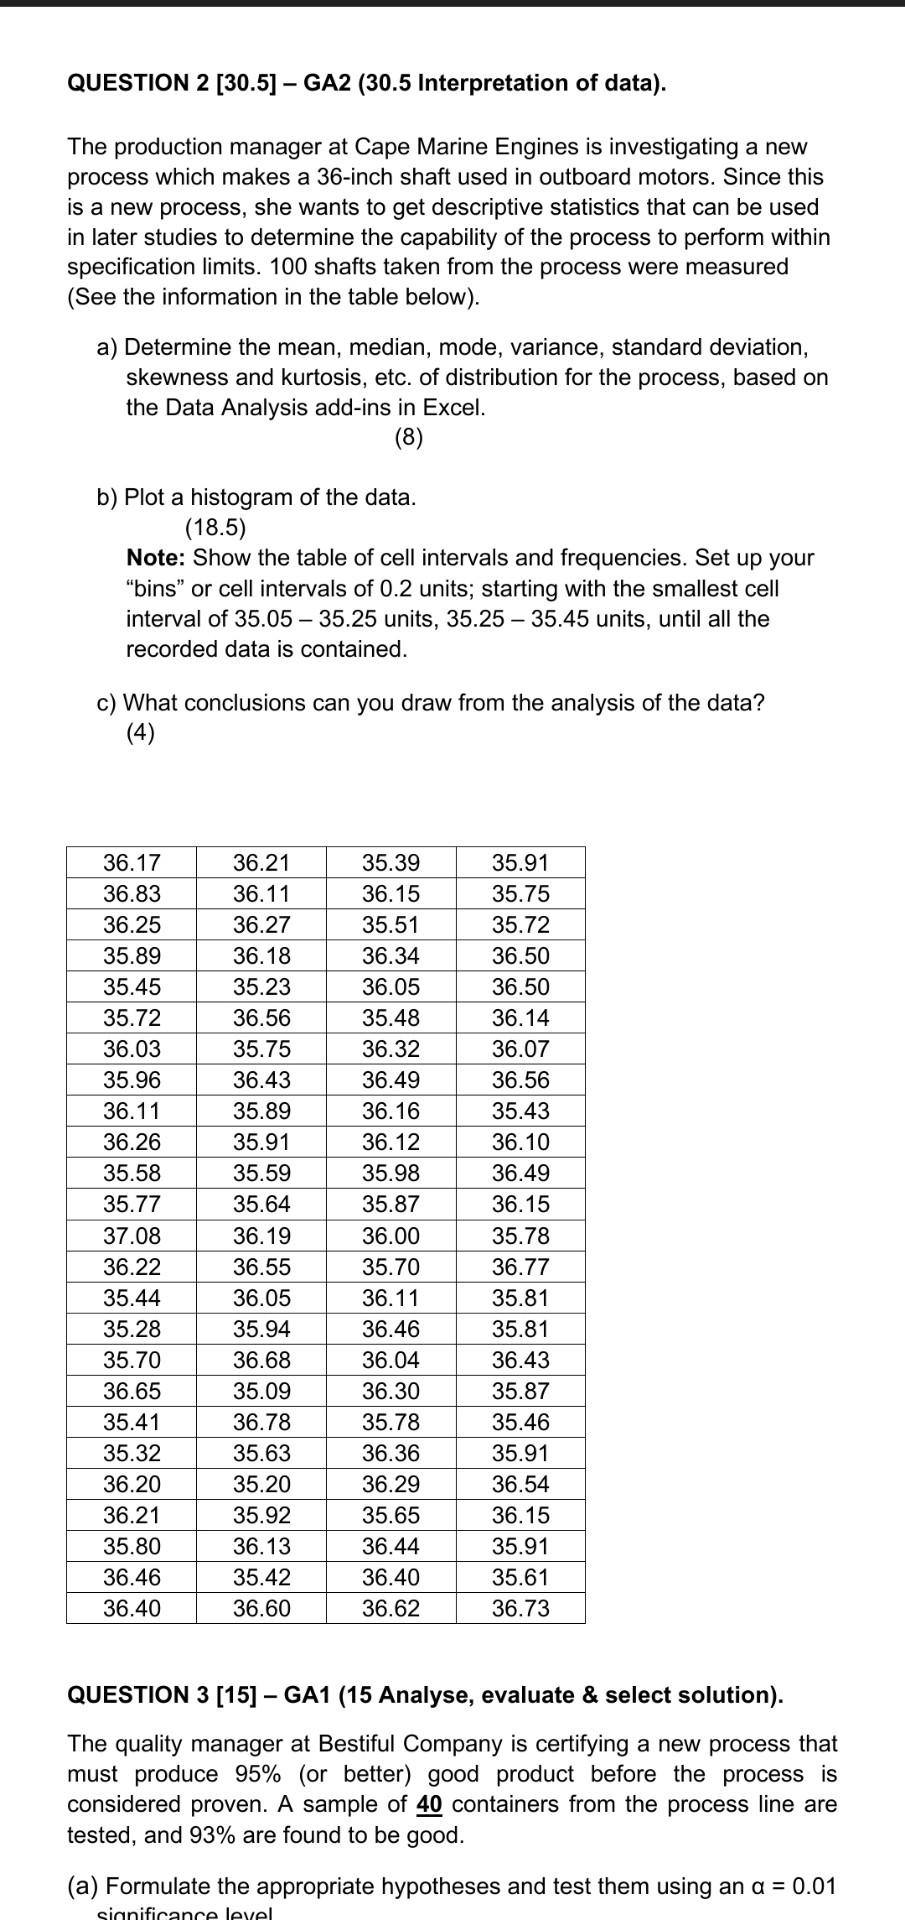
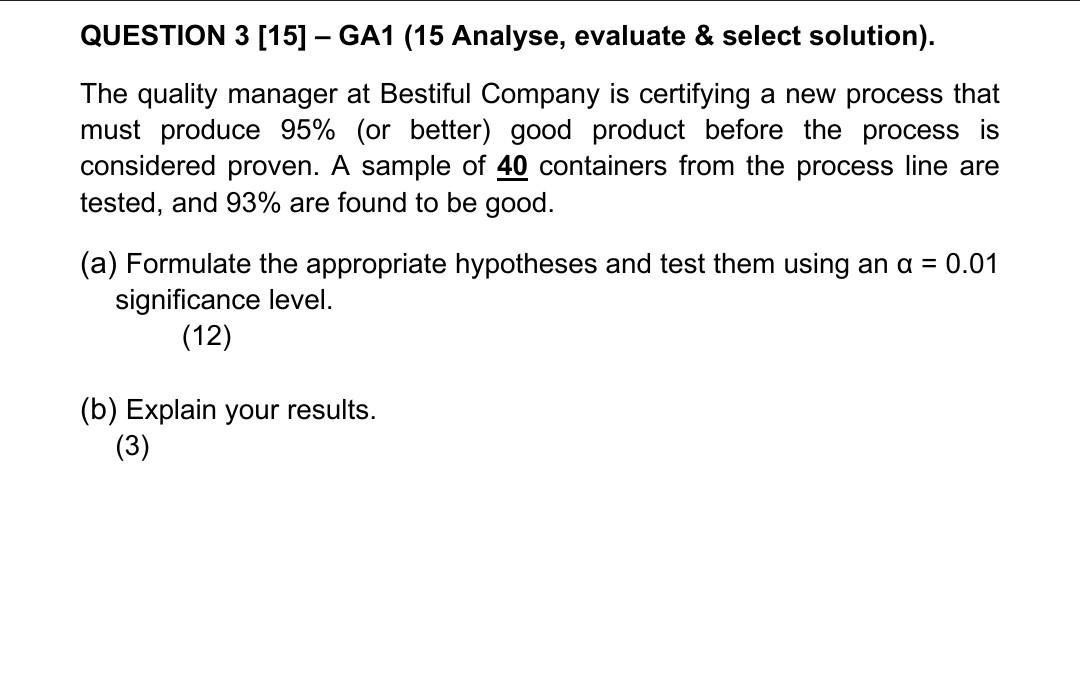
QUESTION 1 [19] - GA2 (19 Calculations). A gauge repeatability and reproducibility study at Frankford Brake Systems collected the data found in the tables below. Carry out a full repeatability and reproducibility (R\&R) analyses of these data. The part specification is 1.00.06mm. (19) QUESTION 2 [30.5] - GA2 (30.5 Interpretation of data). The production manager at Cape Marine Engines is investigating a new process which makes a 36 -inch shaft used in outboard motors. Since this is a new process, she wants to get descriptive statistics that can be used in later studies to determine the capability of the process to perform within specification limits. 100 shafts taken from the process were measured (See the information in the table below). a) Determine the mean, median, mode, variance, standard deviation, skewness and kurtosis, etc. of distribution for the process, based on the Data Analysis add-ins in Excel. (8) b) Plot a histogram of the data. (18.5) Note: Show the table of cell intervals and frequencies. Set up your "bins" or cell intervals of 0.2 units; starting with the smallest cell interval of 35.0535.25 units, 35.2535.45 units, until all the recorded data is contained. c) What conclusions can you draw from the analysis of the data? (4) QUESTION 2 [30.5] - GA2 (30.5 Interpretation of data). The production manager at Cape Marine Engines is investigating a new process which makes a 36 -inch shaft used in outboard motors. Since this is a new process, she wants to get descriptive statistics that can be used in later studies to determine the capability of the process to perform within specification limits. 100 shafts taken from the process were measured (See the information in the table below). a) Determine the mean, median, mode, variance, standard deviation, skewness and kurtosis, etc. of distribution for the process, based on the Data Analysis add-ins in Excel. (8) b) Plot a histogram of the data. (18.5) Note: Show the table of cell intervals and frequencies. Set up your "bins" or cell intervals of 0.2 units; starting with the smallest cell interval of 35.0535.25 units, 35.2535.45 units, until all the recorded data is contained. c) What conclusions can you draw from the analysis of the data? (4) QUESTION 3 [15] - GA1 (15 Analyse, evaluate \& select solution). The quality manager at Bestiful Company is certifying a new process that must produce 95% (or better) good product before the process is considered proven. A sample of 40 containers from the process line are tested, and 93% are found to be good. (a) Formulate the appropriate hypotheses and test them using an =0.01 QUESTION 3 [15] - GA1 (15 Analyse, evaluate \& select solution). The quality manager at Bestiful Company is certifying a new process that must produce 95% (or better) good product before the process is considered proven. A sample of 40 containers from the process line are tested, and 93% are found to be good. (a) Formulate the appropriate hypotheses and test them using an =0.01 significance level. (12) (b) Explain your results. (3) QUESTION 4 [92] - GA1 \& GA2 (30 GA1, identify problem/define problem, 62 GA2 statistical analysis). This is the question that covers the practical done in groups in the laboratory. Put the measurements that you did in the laboratory and carry out the full analyses of the gauge repeatability and reproducibility study that you carried out as a group. All the other questions are individual tasks but your answers on this question must be the same for all 3 or 2 members of the group. Laboratory Practical 1. OBJECTIVES OR PURPOSE OF REPEATABILITY AND REPRODUCIBILITY (R\&R) STUDY EXERCISE a) To study variation in a measurement system using statistical analysis (To carry out a repeatability and reproducibility or R\&R study). b) To test repeatability (equipment variation, EV) - variation in multiple measurements by an individual using the same instrument. c) To test reproducibility (appraiser variation, AV) - variation in the same measuring instrument used by different individuals. d) To take some simple measurements (length, diameter or depth etc.) to use for statistical analysis. DATE, TIME AND VENUE Practical training will take place in the Industrial Engineering laboratory (R-210). The specific dates and times will be communicated to students in due time. 2. REQUIREMENTSIAPPARATUS/RESOURCES The following is required when doing this practical: - Access to the Industrial Engineering laboratory (R210). The Laboratory Technicians will organize access and necessary permits for students. - Vernier Calipers - Micrometre Screw Gauge - Computer with MS Excel/Scientific calculator 3. METHOD/PROCEDURE a) Students are randomly selected into groups of 5 or less. b) Each group should collect 10 small non-food items of their choice (items such as beads, bottle caps, small ceramic tiles, bottles etc.). These items are collected for the purposes of measuring one of their dimensions such as length, width, depth, diameter etc., c) The items of choice should be numbered 1 to 10 . Make sure you choose items that are large enough to be numbered but not exceeding the scale of a Vernier caliper, which is 150mm. Each group collects one type of item for this exercise. d) Decide as a group what your dimension of interest will be (i.e. the one that you will measure such as length, width, depth etc.). e) Use a Vernier caliper or micrometre screw gauge (whichever is more appropriate) to measure the chosen dimension. Specify whether it is length, depth, diameter of item that you chose to measure. Each group member should measure a numbered item three times and record the results as shown on the table below. f) Example of tabulation of results for diametre of 10 tomato sauce bottle caps and 3 group members (each item measured 3 times by a group member) is as shown in the table below. Dimensions should be in millimetres or centimetres; but maintain not less than 2 or 3 decimal places accuracy if possible. g) Place any 3 of the items you were measuring in a secure packaging such as plastic bag, envelope etc. Seal the packaging and write your group number, group members names, student numbers, item description and dimension that was measured on the outside of the packaging. Leave these items with the lab technician (this is for verifying if your results are consistent with what you measured). h) Students are assumed to be competent in the use of the Vernier caliper and/or micrometre screw gauge to measure dimensions. QUESTION 5 [14] - GA2 (14 theory in engineering problems). An automatic cookie machine at ACM, Inc., must deposit a specified amount of 250.3 grams (g) of dough for each cookie on a conveyor belt. It costs $0.03 to scrap a defective cookie. A sample of 50 cookies was drawn from the production process, which has been determined to be approximatelv normallv distributed, and the results, in arams, can be found in the table below. a) Calculate the value of k in the Taguchi loss function. (9) b) Determine how much the process varies from the target specification, based on the mean difference and standard deviation of the sample results. Calculate the expected loss per unit. QUESTION 6 [19] - GA1 (19 Analyse, evaluate \& select solution). Qualiparts, a supplier of parts to the auto industry, wants to test to determine if the strength of wire used to make alternators is significantly higher for any of four potential subcontractors. The four subcontractors agreed to submit sample information from 10 samples, using a standardised test provided by Qualiparts, as provided in the data in the table below. Use the single factor ANOVA Excel tool to determine if there is a significant difference between the strength scores of the four contractors at the 5 percent level. (19) QUESTION 7 [15] - GA2 (15 Calculations). At White Clay Pottery, a kiln is used to bake ceramic pottery. The production manager wishes to determine the relationship between temperature and brittleness, so he takes measurements of the brittleness of test items versus the temperature of the oven in degrees C (see Table Q7 below). 7es C at White Clay Pottery (d) Show the plot of the correlation between the two variables (i.e. Temperature line fit plot). (7) QUESTION 8 [12] - GA1 (12 Implement solution). You have most likely taken your car for service at an automobile dealership. Typical activities in servicing a customer's automobile include making an appointment, meeting with a service advisor to discuss the service or problem, waiting for the work to be performed, paying the bill, and receiving the vehicle. a) Draw a flowchart for this process with detailed activities for these steps. (8) b) Identify at least four potential failures that customers may experience and discuss possible poke-yokes (for each failure), that the dealership might use to prevent such failures and ensure customer satisfaction. (4)
Step by Step Solution
There are 3 Steps involved in it

Get step-by-step solutions from verified subject matter experts