

Question: 2. Demand Estimation (27 points) The file Comm172 Assignment1 Data_2021. x1sx contains store sales data for Heineken beer. The data for this question are in
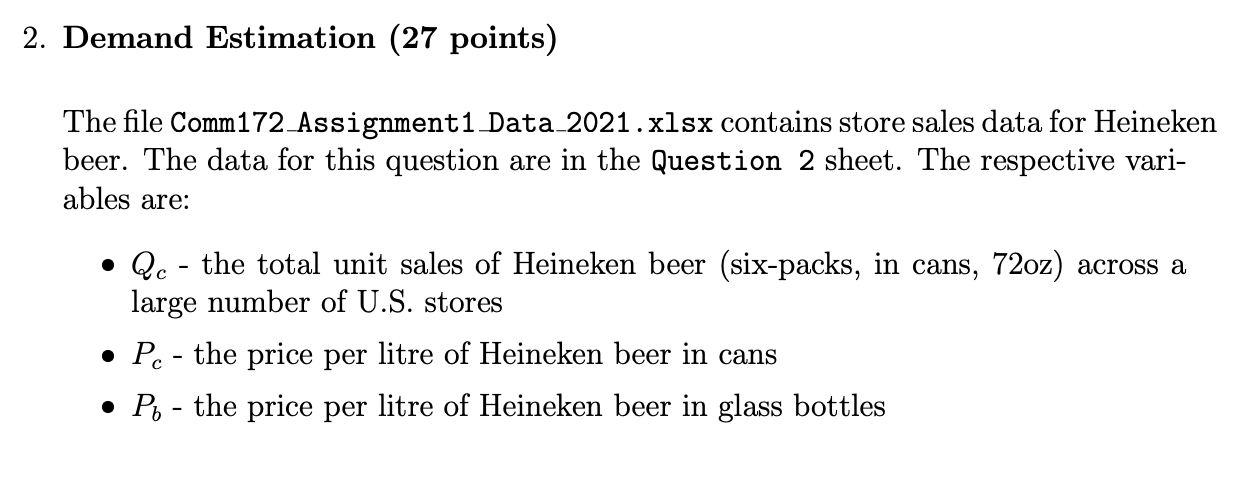
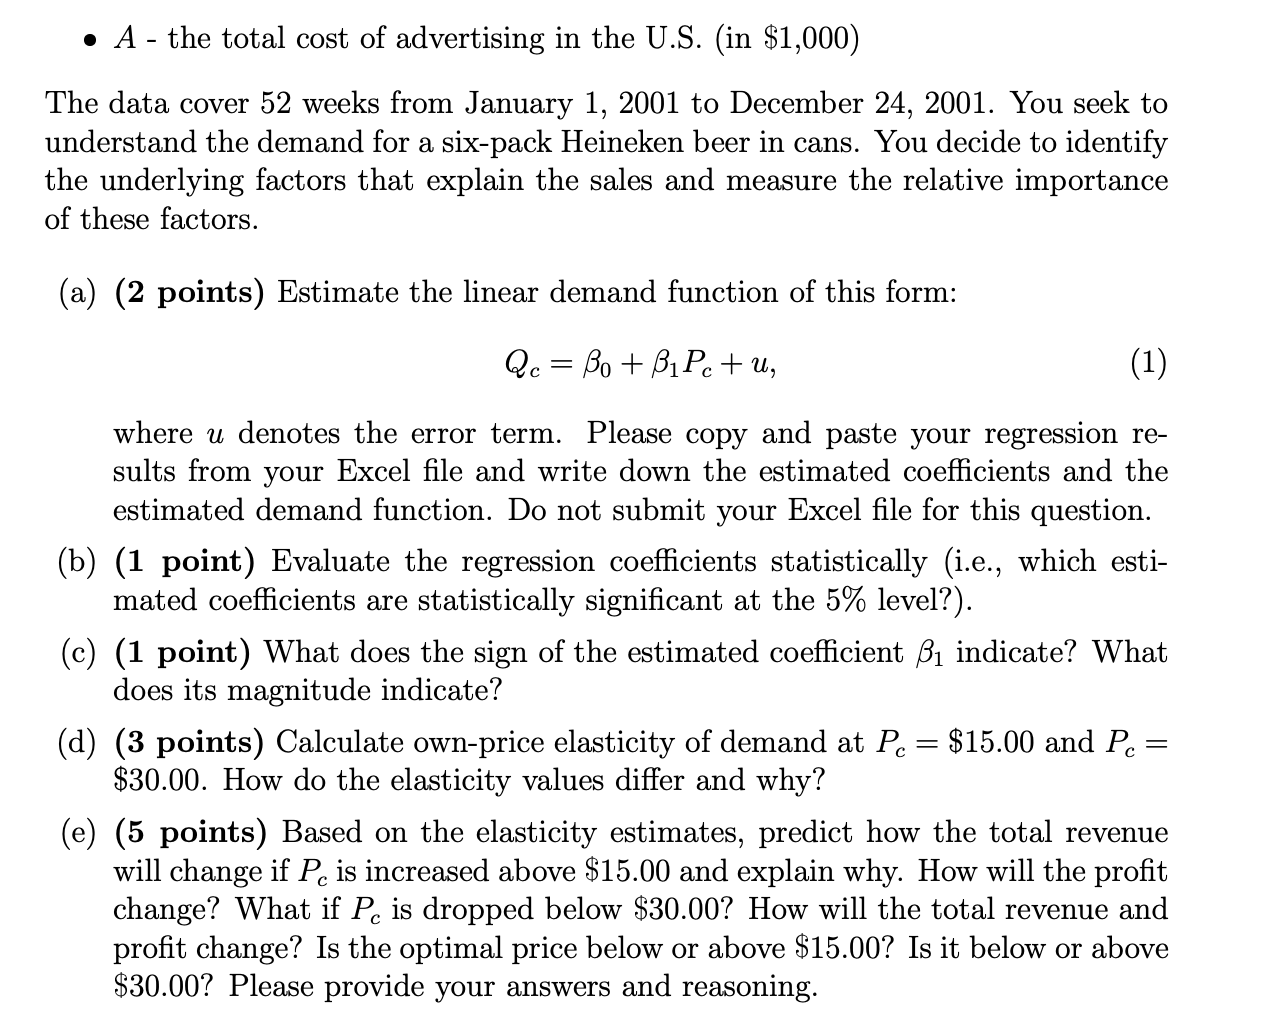
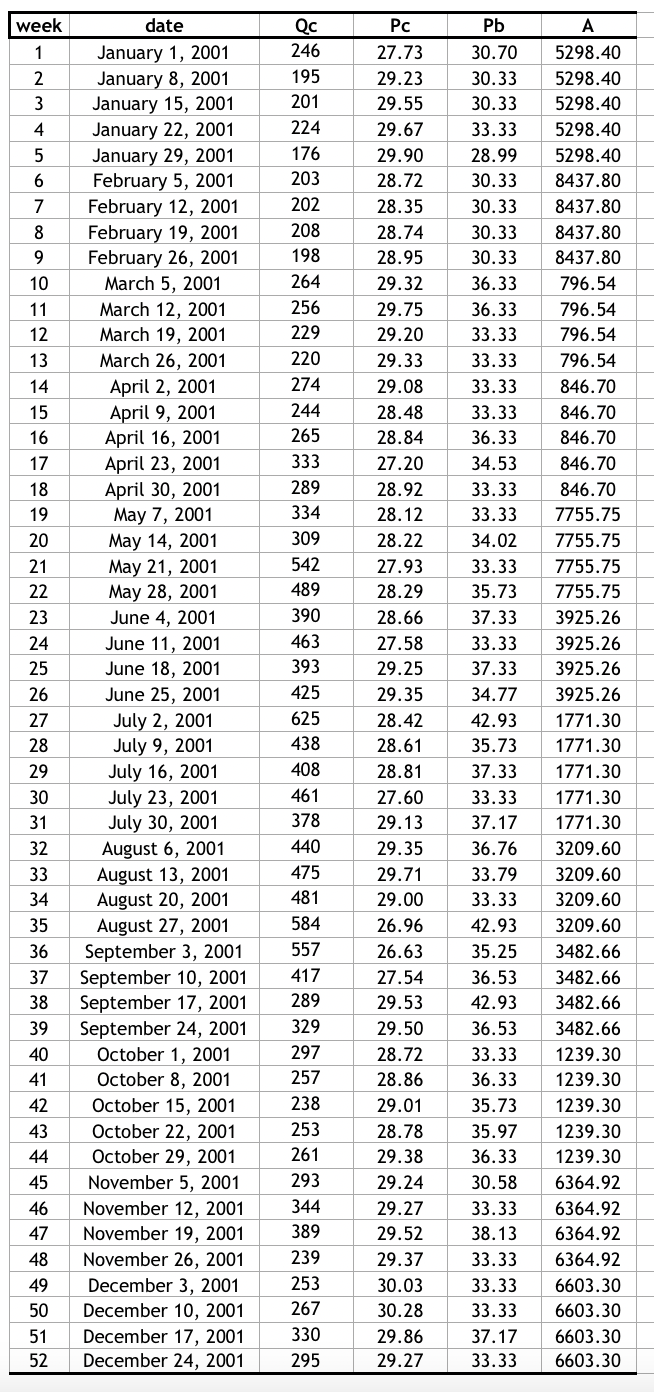
2. Demand Estimation (27 points) The file Comm172 Assignment1 Data_2021. x1sx contains store sales data for Heineken beer. The data for this question are in the Question 2 sheet. The respective vari- ables are: . Qc - the total unit sales of Heineken beer (six-packs, in cans, 72oz) across a large number of U.S. stores . Pc - the price per litre of Heineken beer in cans . Po - the price per litre of Heineken beer in glass bottles. A - the total cost of advertising in the U.S. (in $1,000) The data cover 52 weeks from January 1, 2001 to December 24, 2001. You seek to understand the demand for a six-pack Heineken beer in cans. You decide to identify the underlying factors that explain the sales and measure the relative importance of these factors. (a) (2 points) Estimate the linear demand function of this form: Qc = Bo+ B1Pc+ u, (1) where u denotes the error term. Please copy and paste your regression re- sults from your Excel file and write down the estimated coefficients and the estimated demand function. Do not submit your Excel file for this question. (b) (1 point) Evaluate the regression coefficients statistically (i.e., which esti- mated coefficients are statistically significant at the 5% level?). (c) (1 point) What does the sign of the estimated coefficient 1 indicate? What does its magnitude indicate? (d) (3 points) Calculate own-price elasticity of demand at Pc = $15.00 and Pc = $30.00. How do the elasticity values differ and why? (e) (5 points) Based on the elasticity estimates, predict how the total revenue will change if Pc is increased above $15.00 and explain why. How will the profit change? What if Pc is dropped below $30.00? How will the total revenue and profit change? Is the optimal price below or above $15.00? Is it below or above $30.00? Please provide your answers and reasoning.week date Qc Pc Pb A 1 January 1, 2001 246 27.73 30.70 5298.40 2 January 8, 2001 195 29.23 30.33 5298.40 W January 15, 2001 201 29.55 30.33 5298.40 January 22, 2001 224 29.67 33.33 5298.40 January 29, 2001 176 29.90 28.99 5298.40 February 5, 2001 203 28.72 30.33 8437.80 February 12, 2001 202 28.35 30.33 8437.80 February 19, 2001 208 28.74 30.33 8437.80 February 26, 2001 198 28.95 30.33 8437.80 10 March 5, 2001 264 29.32 36.33 796.54 11 March 12, 2001 256 29.75 36.33 796.54 12 March 19, 2001 229 29.20 33.33 796.54 13 March 26, 2001 220 29.33 33.33 796.54 14 April 2, 2001 274 29.08 33.33 846.70 15 April 9, 2001 244 28.48 33.33 846.70 16 April 16, 2001 265 28.84 36.33 846.70 17 April 23, 2001 333 27.20 34.53 846.70 18 April 30, 2001 289 28.92 33.33 846.70 19 May 7, 2001 334 28.12 33.33 7755.75 20 May 14, 2001 309 28.22 34.02 7755.75 21 May 21, 2001 542 27.93 33.33 7755.75 22 May 28, 2001 489 28.29 35.73 7755.75 23 June 4, 2001 390 28.66 37.33 3925.26 24 June 11, 2001 463 27.58 33.33 3925.26 25 June 18, 2001 393 29.25 37.33 3925.26 26 June 25, 2001 425 29.35 34.77 3925.26 27 July 2, 2001 625 28.42 42.93 1771.30 28 July 9, 2001 438 28.61 35.73 1771.30 29 July 16, 2001 408 28.81 37.33 1771.30 30 July 23, 2001 461 27.60 33.33 1771.30 31 July 30, 2001 378 29.13 37.17 1771.30 32 August 6, 2001 440 29.35 36.76 3209.60 33 August 13, 2001 475 29.71 33.79 3209.60 34 August 20, 2001 481 29.00 33.33 3209.60 35 August 27, 2001 584 26.96 42.93 3209.60 36 September 3, 2001 557 26.63 35.25 3482.66 37 September 10, 2001 417 27.54 36.53 3482.66 38 September 17, 2001 289 29.53 42.93 3482.66 39 September 24, 2001 329 29.50 36.53 3482.66 40 October 1, 2001 297 28.72 33.33 1239.30 41 October 8, 2001 257 28.86 36.33 1239.30 42 October 15, 2001 238 29.01 35.73 1239.30 43 October 22, 2001 253 28.78 35.97 1239.30 44 October 29, 2001 261 29.38 36.33 1239.30 45 November 5, 2001 293 29.24 30.58 6364.92 46 November 12, 2001 344 29.27 33.33 6364.92 47 November 19, 2001 389 29.52 38.13 6364.92 48 November 26, 2001 239 29.37 33.33 6364.92 49 December 3, 2001 253 30.03 33.33 6603.30 50 December 10, 2001 267 30.28 33.33 6603.30 51 December 17, 2001 330 29.86 37.17 6603.30 52 December 24, 2001 295 29.27 33.33 6603.30
Step by Step Solution
There are 3 Steps involved in it

Get step-by-step solutions from verified subject matter experts