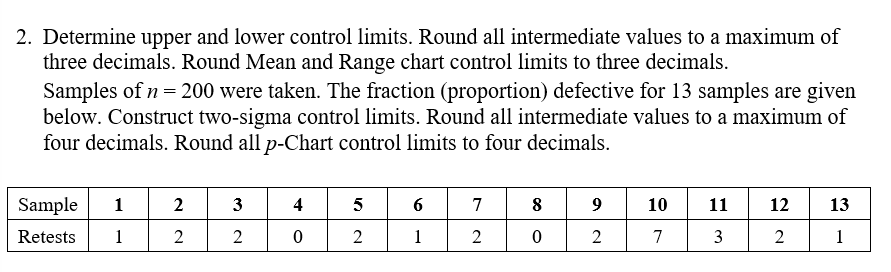
Question: 2. Determine upper and lower control limits. Round all intermediate values to a maximum of three decimals. Round Mean and Range chart control limits to

2. Determine upper and lower control limits.

2. Determine upper and lower control limits. Round all intermediate values to a maximum of three decimals. Round Mean and Range chart control limits to three decimals. Samples of n= 200 were taken. The fraction (proportion) defective for 13 samples are given below. Construct two-sigma control limits. Round all intermediate values to a maximum of four decimals. Round all p-Chart control limits to four decimals. Sample 1 2 3 4 5 6 7 8 9 10 11 12 13 Retests 1 2 2 0 2 1 2 0 2 7 3 2 1

Step by Step Solution

There are 3 Steps involved in it

1 Expert Approved Answer
Step: 1 Unlock blur-text-image
Question Has Been Solved by an Expert!

Get step-by-step solutions from verified subject matter experts

Step: 2 Unlock
Step: 3 Unlock

Students Have Also Explored These Related General Management Questions!