

Question: Determine upper and lower control limits. Round all intermediate values to a maximum of three decimals. Round Mean and Range chart control limits to
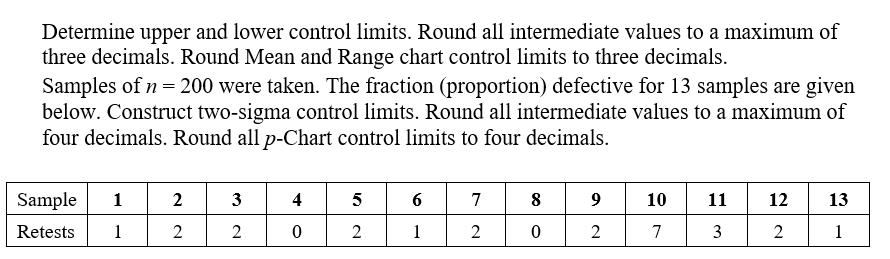
Determine upper and lower control limits. Round all intermediate values to a maximum of three decimals. Round Mean and Range chart control limits to three decimals. Samples of n = 200 were taken. The fraction (proportion) defective for 13 samples are given below. Construct two-sigma control limits. Round all intermediate values to a maximum of four decimals. Round all p-Chart control limits to four decimals. Sample 1 Retests 1 2 2 3 2 4 0 5 2 6 1 7 2 8 0 9 2 10 7 11 3 12 2 13 1
Step by Step Solution
There are 3 Steps involved in it
The image shows a data table with two rows labeled Sample and Retests The Sample row lists numbers from 1 to 13 representing the individual samples Th... View full answer

Get step-by-step solutions from verified subject matter experts