

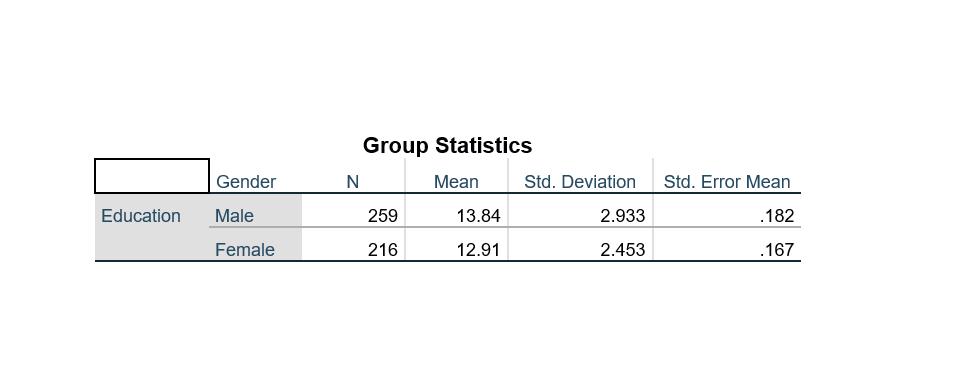
Question: 2. Does our data provide sufficient evidence that the average years of education of readers who indicated Business as their favourite section of the paper


2. Does our data provide sufficient evidence that the average years of education of readers who indicated Business as their favourite section of the paper significantly greater than that of readers who favoured the Sport section as their favourite section?
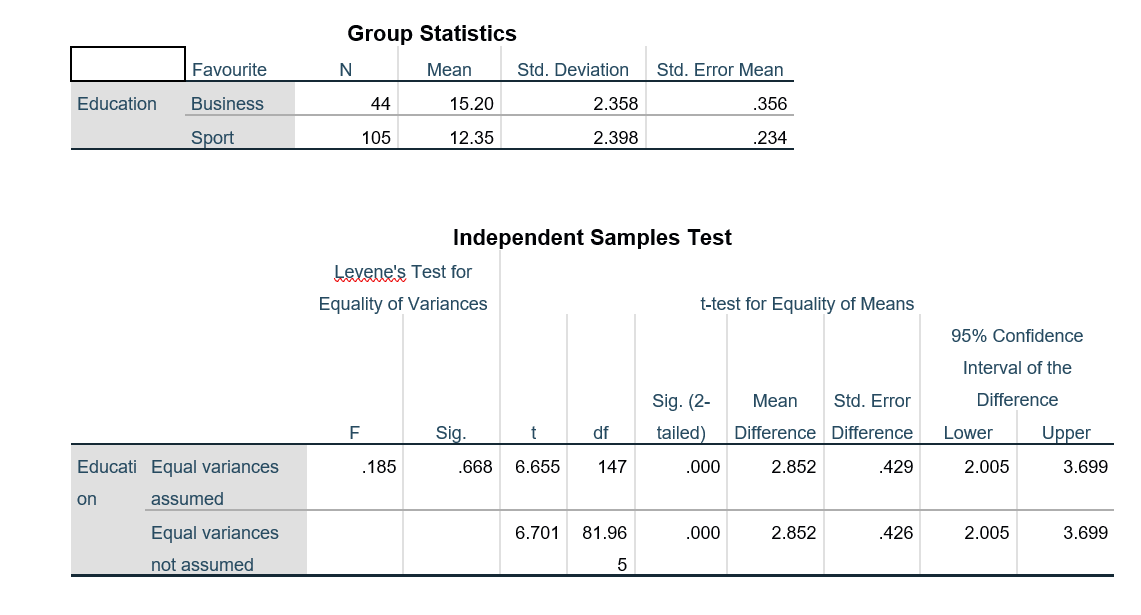
a. Write out the appropriate null and alternative hypotheses for this test.
b. Can we assume equal variances for this test? (use a 10% level of significance)
c. From the appropriate SPSS output, state the value of the test statistic and use the p-value to make the decision of the test. (Use ? = 0.05)
d. Interpret your result in context.
e. Show that the necessary condition/s hold for this test to be valid.
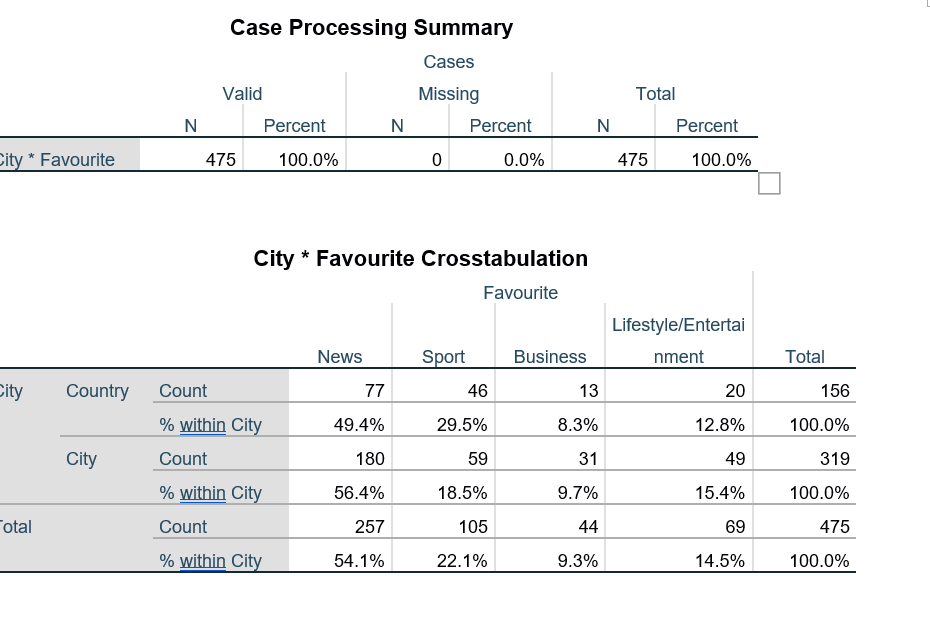
3. Does our data provide sufficient evidence that a greater proportion of country readers rate sport as their favourite section of the paper than do city living readers? (Using ? = 0.05)
a. Write out the hypotheses being tested.
b. Calculate the value of the test statistic (show all working)
c. State the conclusion of the hypothesis test and show how you reached your decision.
d. Interpret your test result in context.
e. Show that the necessary conditions hold for the test to be valid.
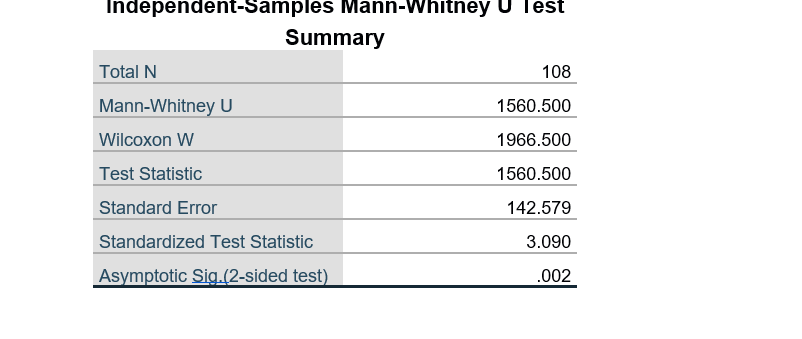
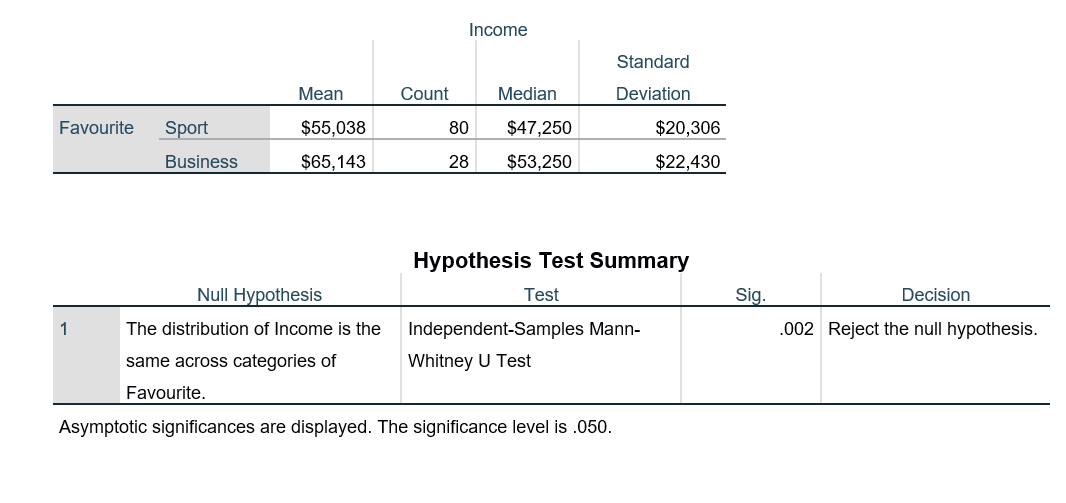
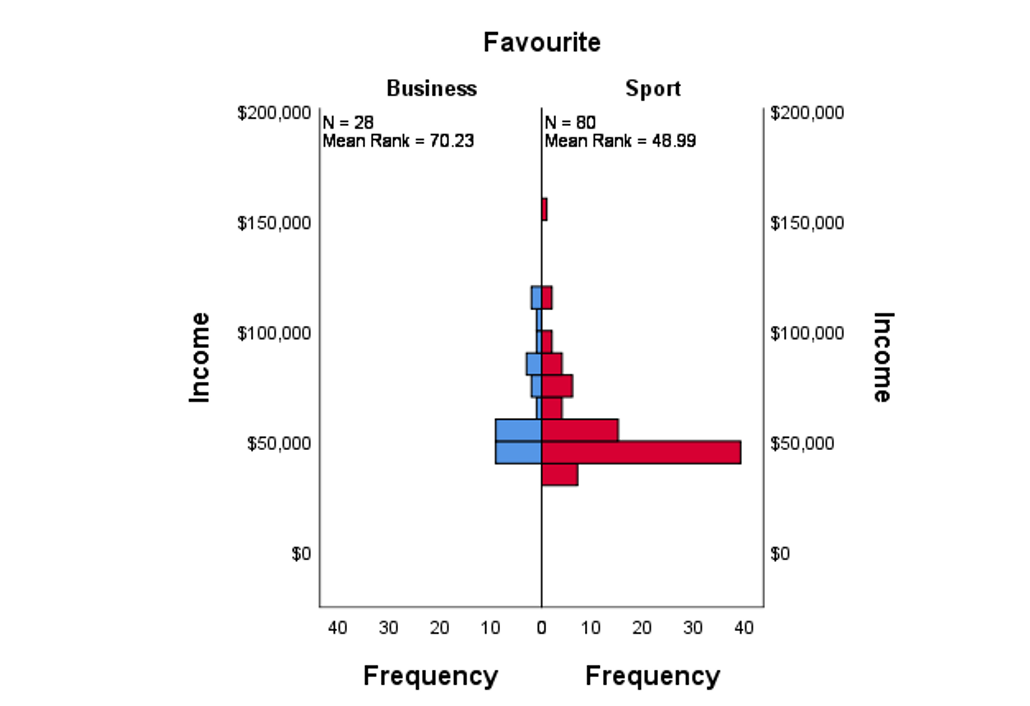
4. Does our data provide sufficient evidence that the level of Income for male readers who rate Business as their favourite section is greater than the level of Income for male readers who rate Sport as their favourite section?
a. Why must we use a nonparametric test to answer the above question?
b. State the null and alternative hypotheses being tested.
c. From the appropriate SPSS output, state the value of the standardised test statistic and use the p-value to make the decision of the test. (Use ? = 0.05)
d. Interpret your result in context.
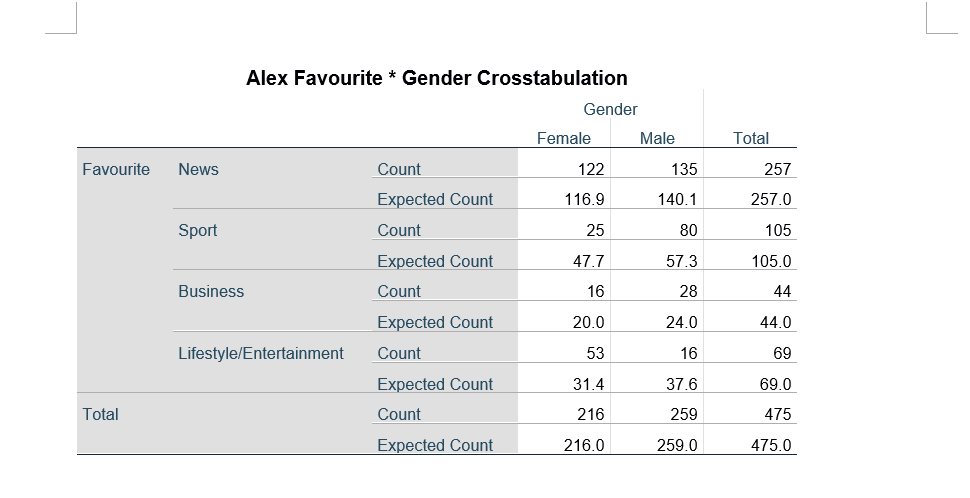
5. Are Daily Express readers' favourite sections of the paper independent of gender? Use ? = 0.05.
a. Write out the appropriate null and alternative hypotheses for this test.
b. State the value of the test statistic and use the p value to make your decision.
c. Interpret your results in context.
d. Show that the necessary conditions hold for the test to be valid.
e. Show how the expected number of female readers whose favourite section is Sport is calculated.
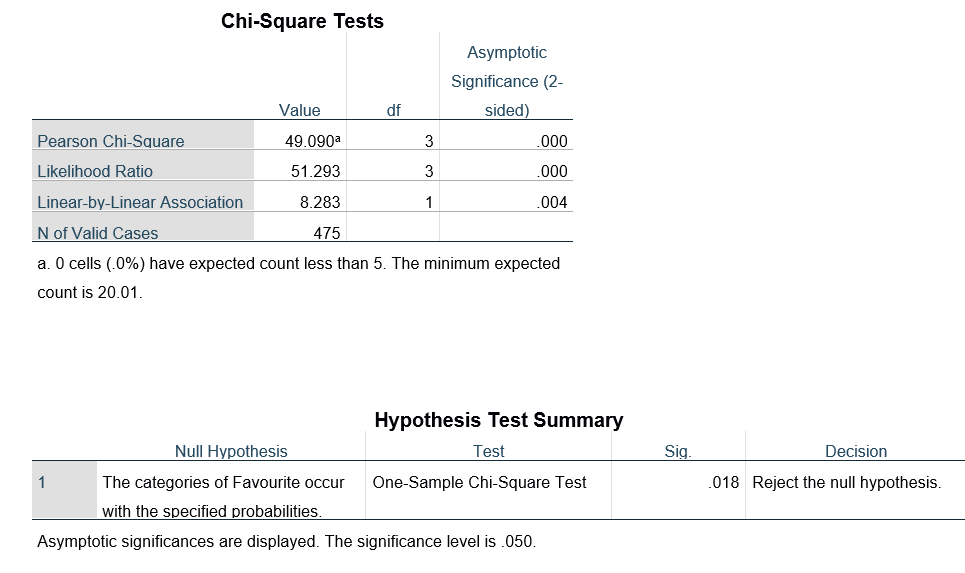
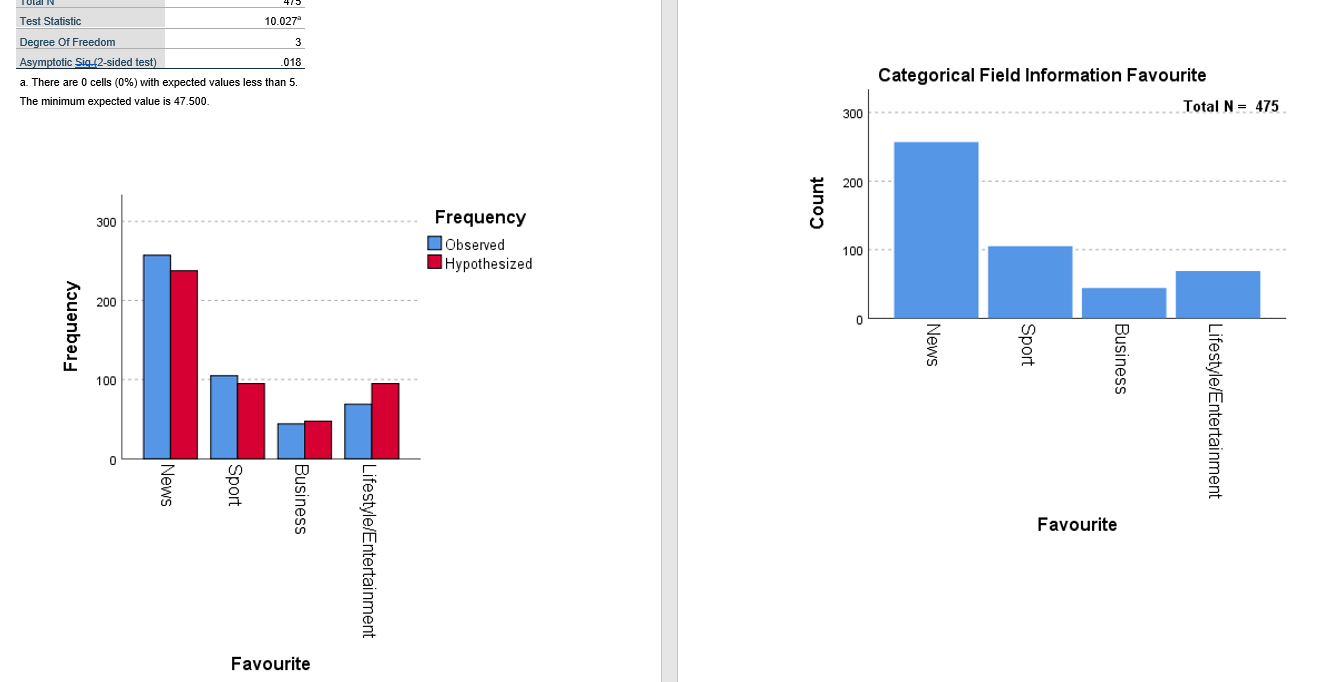
6. When selling advertising space in the paper the marketing department use the following breakdown of Favourite section of the paper; news 50%, Sport 20%, Business 10%, Lifestyle and entertainment 20%. The paper would like to know if the above weightings for favourite section of the paper are still valid is still valid. (Use ? = 0.05)
a. Write out the appropriate null and alternative hypothesis for this test.
b. From the SPSS output, state the value of the test statistic and use the p-value to make the decision of the test.
c. Interpret your result in context
d. Show that the necessary condition/s hold for this test to be valid
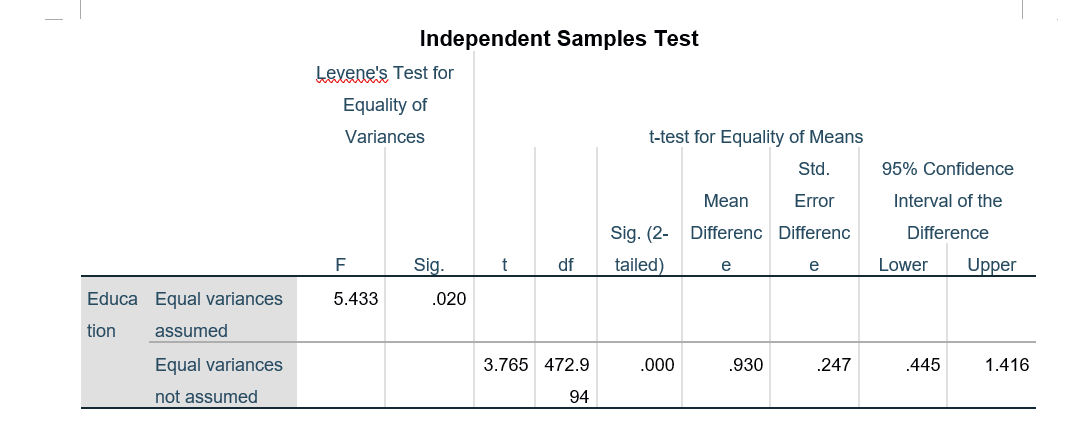
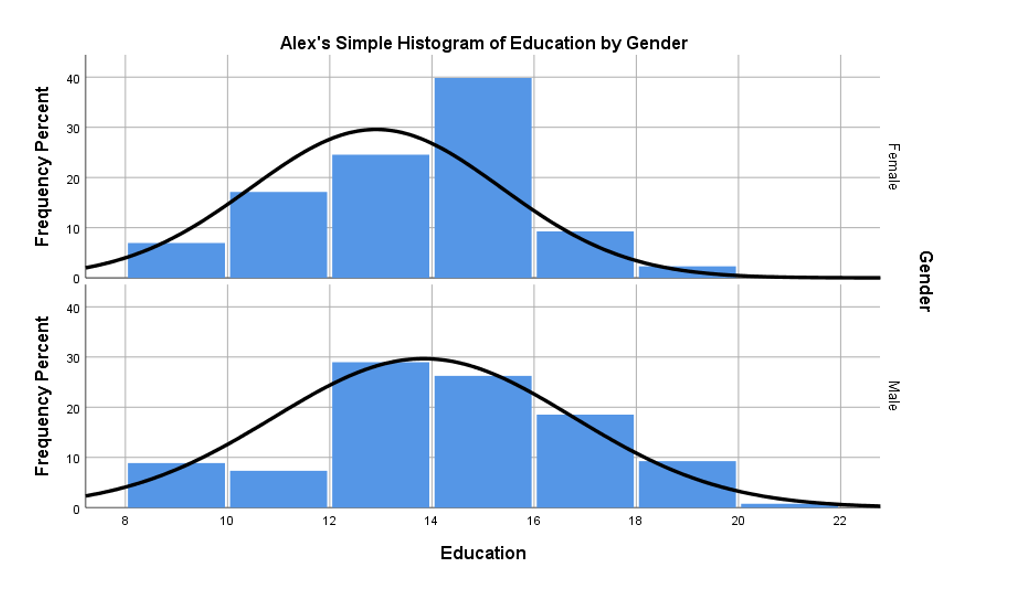


Independent Samples Test Levene's Test for Equality of Variances t-test for Equality of Means Std. 95% Confidence Mean Error Interval of the Sig. (2- Differencefferenc Difference F Sig. df tailed) e e Lower Upper Educa Equal variances 5.433 020 tion assumed Equal variances 3.765 472.9 000 930 .247 445 1.416 not assumed 94Alex's Simple Histogram of Education by Gender 40 30 Frequency Percent 20 Female 10 O Gender 40 30 Frequency Percent 20 Male 10 8 10 12 14 16 18 20 22 EducationGroup Statistics Favourite N Mean Std. Deviation Std. Error Mean Education Business 44 15.20 2.358 356 Sport 105 12.35 2.398 234 Independent Samples Test Levene's Test for Equality of Variances t-test for Equality of Means 95% Confidence Interval of the Sig. (2- Mean Std. Error Difference F Sig. df tailed) Difference Difference Lower Upper Educatiqual variances 185 668 6.655 147 000 2.852 429 2.005 3.699 on assumed Equal variances 6.701 81.96 000 2.852 426 2.005 3.699 not assumed 5Case Processing Summary Cases Valid Missing Total N Percent N Percent N Percent ity * Favourite 475 100.0% 0 0.0% 475 100.0% City *Favourite Crosstabulation Favourite Lifestyle/Entertai News Sport Business nment Total City Country Count 77 46 13 20 156 % within City 49.4% 29.5% 8.3% 12.8% 100.0% City Count 180 59 31 49 319 within City 56.4% 18.5% 9.7% 15.4% 100.0% otal Count 257 105 44 69 475 % within City 54.1% 22.1% 9.3% 14.5% 100.0%\fGrou p Statistics Gender N Mean Std. Deviation Std. Error Mean Education Male 259 13.84 2.933 .182 Female 216 12.91 2.453 .167
Step by Step Solution
There are 3 Steps involved in it

Get step-by-step solutions from verified subject matter experts