

Question: 2. Draw one graph for the majority group when the majority's demand curve for resources is equal to MBMAJ1 3,000-12QMAJ1 and a marginal cost
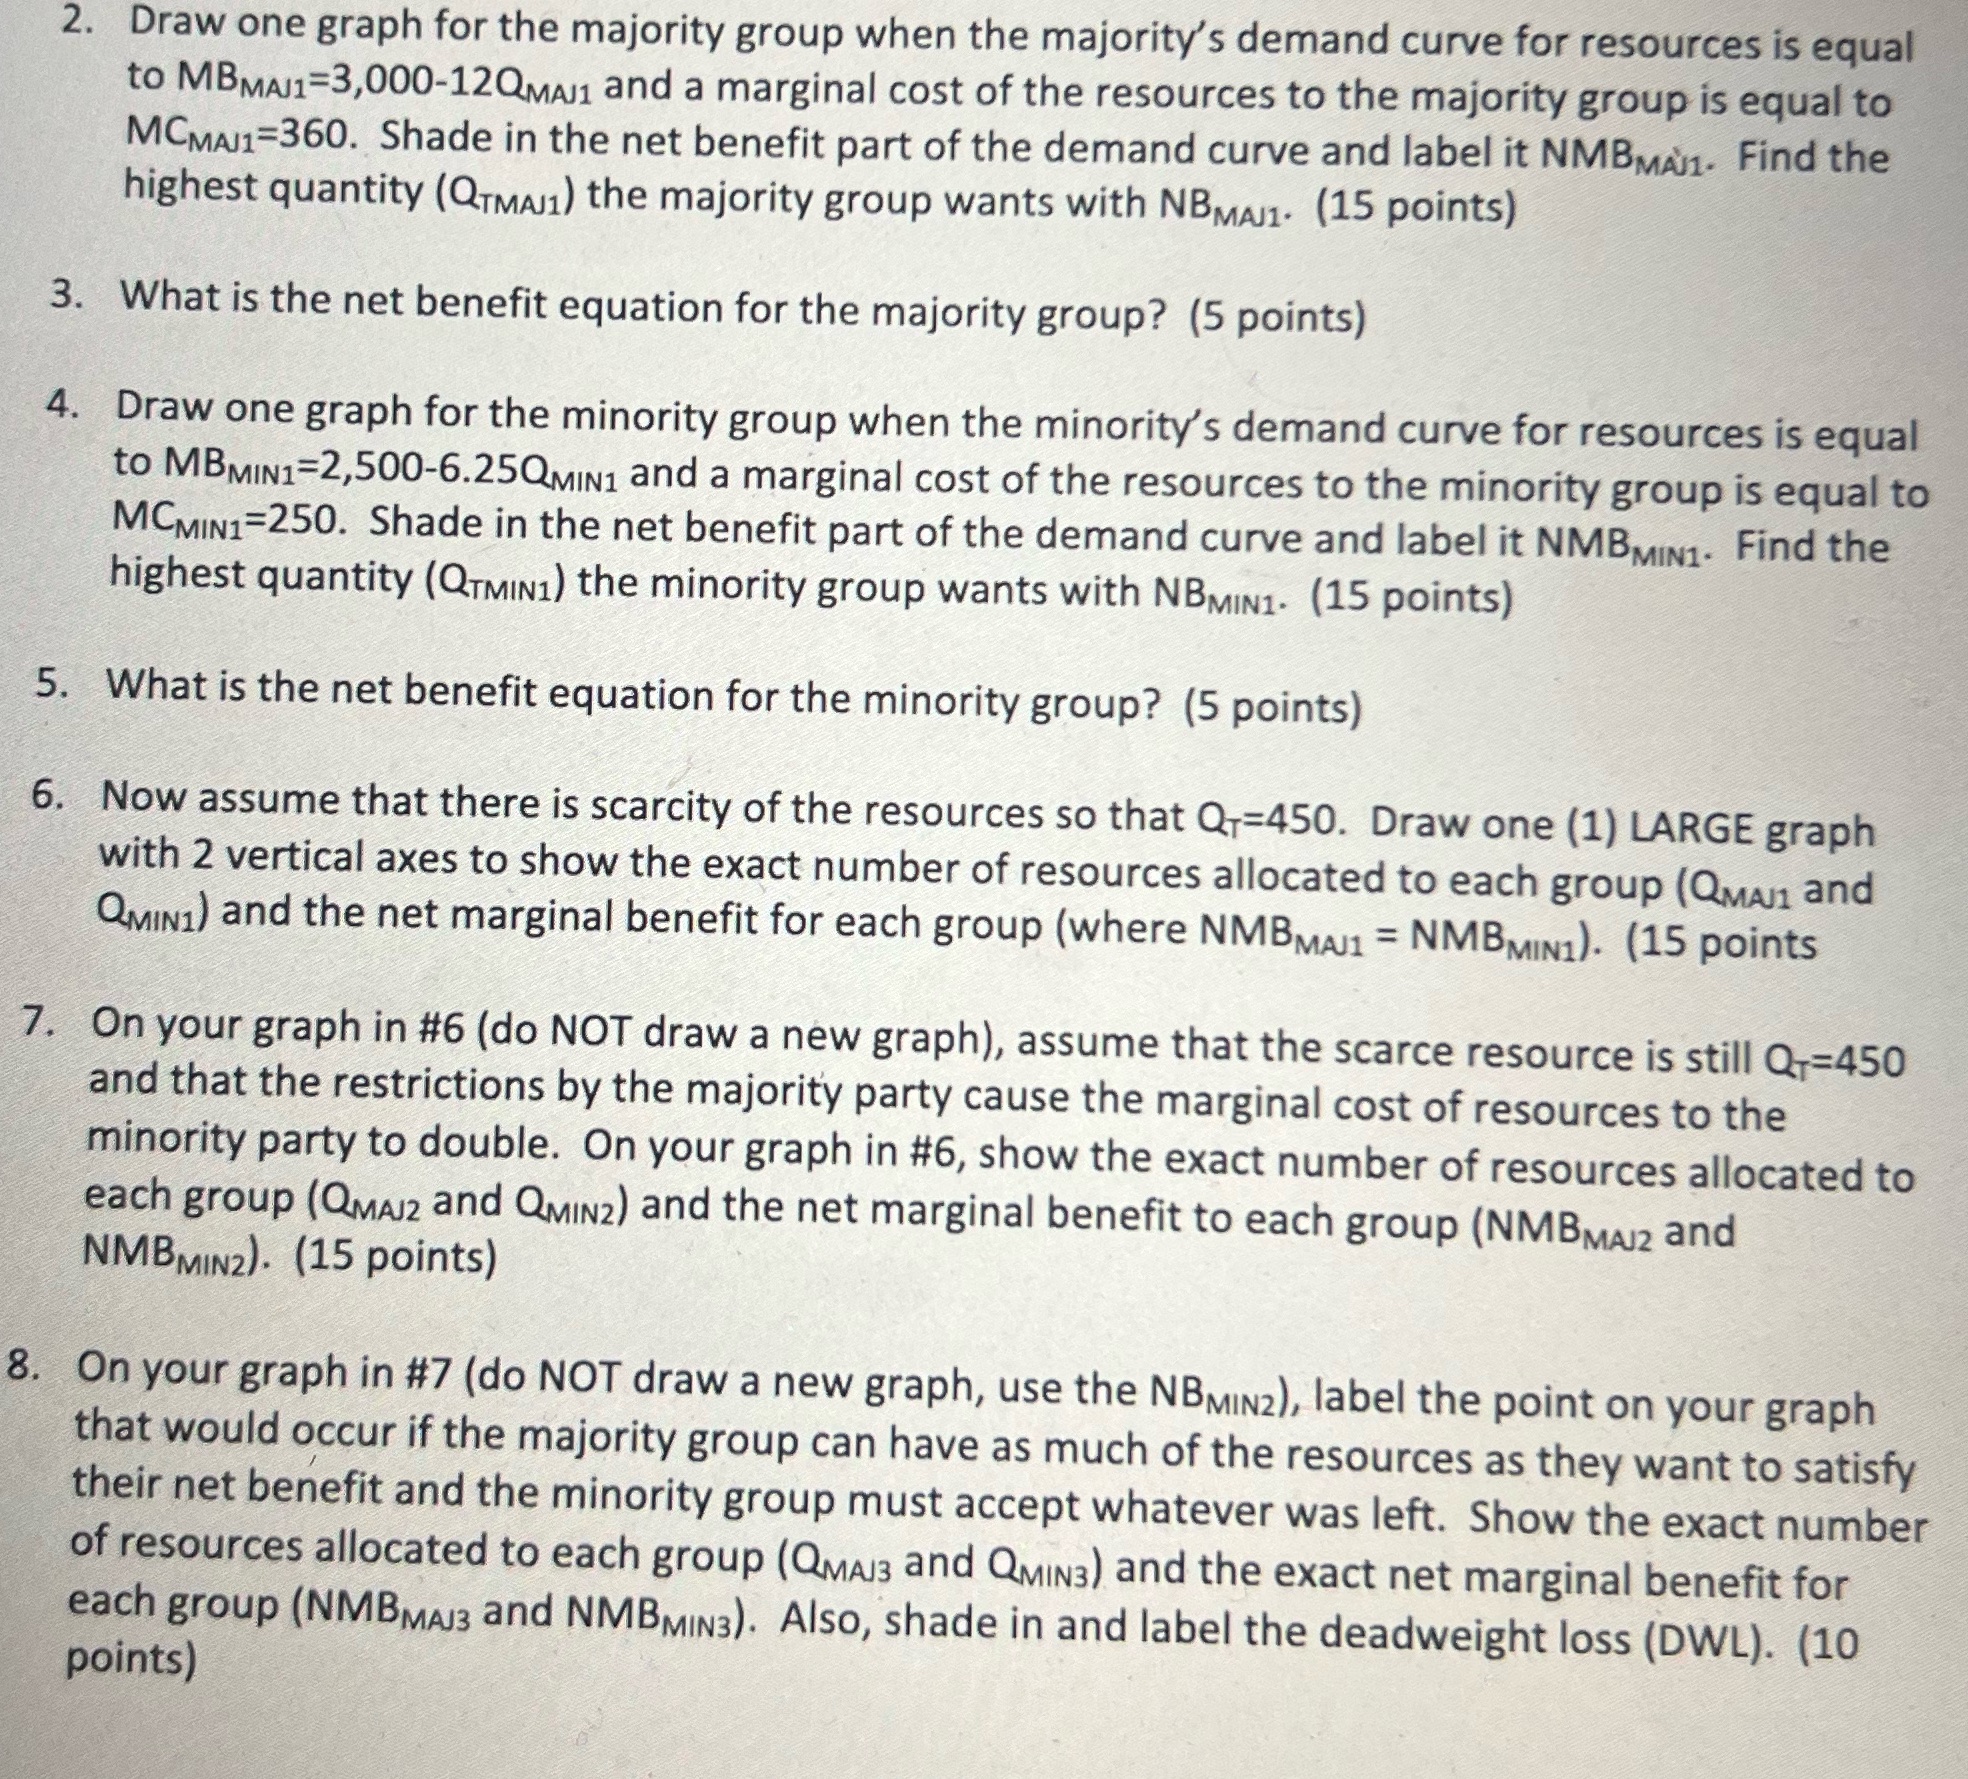
2. Draw one graph for the majority group when the majority's demand curve for resources is equal to MBMAJ1 3,000-12QMAJ1 and a marginal cost of the resources to the majority group is equal to MCMAJ1-360. Shade in the net benefit part of the demand curve and label it NMBMA1. Find the highest quantity (QTMA1) the majority group wants with NBMA1. (15 points) 3. What is the net benefit equation for the majority group? (5 points) 4. Draw one graph for the minority group when the minority's demand curve for resources is equal to MBMIN1-2,500-6.25QMIN1 and a marginal cost of the resources to the minority group is equal to MCMIN1 250. Shade in the net benefit part of the demand curve and label it NMB MIN1- Find the highest quantity (QTMIN1) the minority group wants with NBMIN1- (15 points) 5. What is the net benefit equation for the minority group? (5 points) 6. Now assume that there is scarcity of the resources so that Q+=450. Draw one (1) LARGE graph with 2 vertical axes to show the exact number of resources allocated to each group (QMAJ1 and QMIN1) and the net marginal benefit for each group (where NMBMAJ = NMBMIN1). (15 points 7. On your graph in #6 (do NOT draw a new graph), assume that the scarce resource is still Q+=450 and that the restrictions by the majority party cause the marginal cost of resources to the minority party to double. On your graph in #6, show the exact number of resources allocated to each group (QMAJ2 and QMIN2) and the net marginal benefit to each group (NMBMAJ2 and NMBMIN2). (15 points) 8. On your graph in #7 (do NOT draw a new graph, use the NBMIN2), label the point on your graph that would occur if the majority group can have as much of the resources as they want to satisfy their net benefit and the minority group must accept whatever was left. Show the exact number of resources allocated to each group (QMAJ3 and QMIN3) and the exact net marginal benefit for each group (NMBMAJ3 and NMB MIN3). Also, shade in and label the deadweight loss (DWL). (10 points)
Step by Step Solution
There are 3 Steps involved in it

Get step-by-step solutions from verified subject matter experts