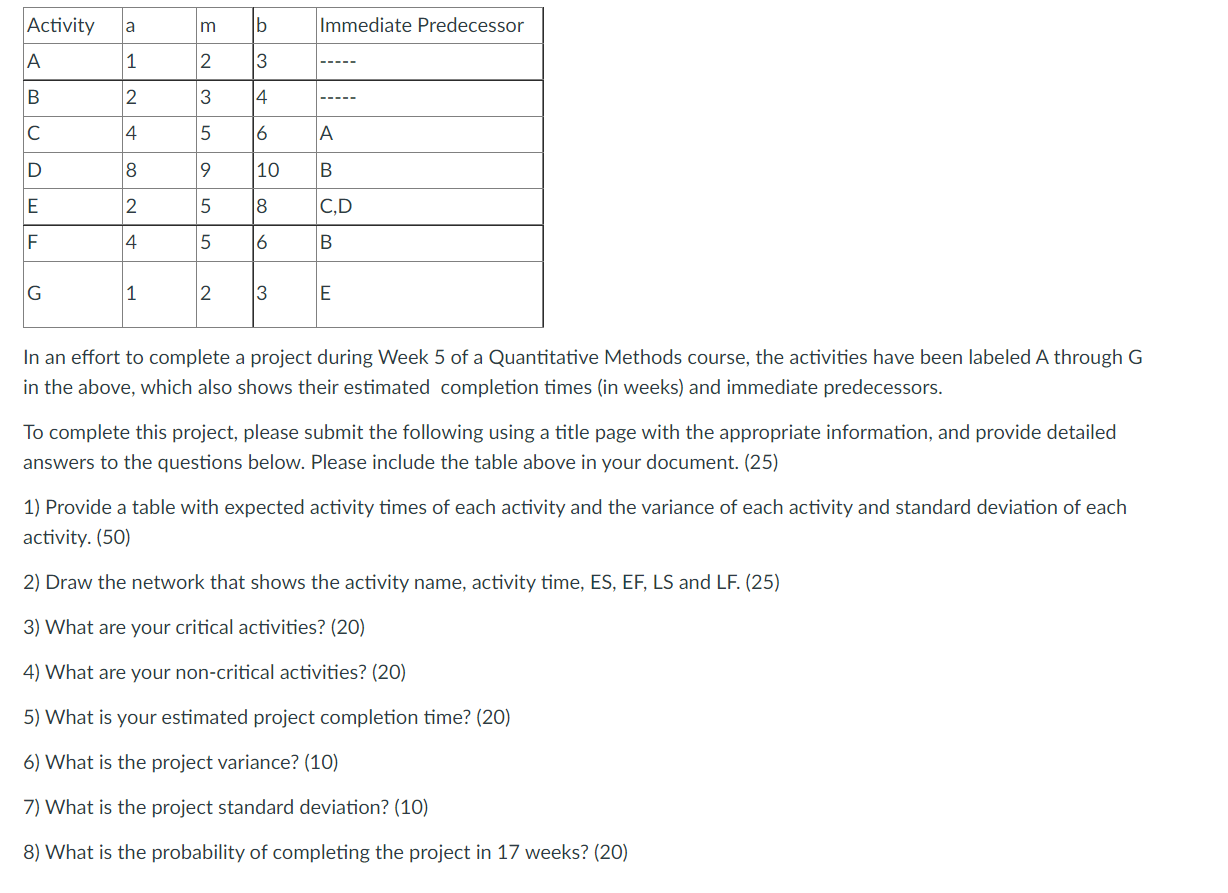
Question: 2) Draw the network that shows the activity name, activity time, ES, EF, LS and LF. In an effort to complete a project during Week

2) Draw the network that shows the activity name, activity time, ES, EF, LS and LF.

2) Draw the network that shows the activity name,

In an effort to complete a project during Week 5 of a Quantitative Methods course, the activities have been labeled A through G in the above, which also shows their estimated completion times (in weeks) and immediate predecessors. To complete this project, please submit the following using a title page with the appropriate information, and provide detailed answers to the questions below. Please include the table above in your document. (25) 1) Provide a table with expected activity times of each activity and the variance of each activity and standard deviation of each activity. (50) 2) Draw the network that shows the activity name, activity time, ES, EF, LS and LF. (25) 3) What are your critical activities? (20) 4) What are your non-critical activities? (20) 5) What is your estimated project completion time? (20) 6) What is the project variance? (10) 7) What is the project standard deviation? (10) 8) What is the probability of completing the project in 17 weeks? (20)

Step by Step Solution

There are 3 Steps involved in it

1 Expert Approved Answer
Step: 1 Unlock blur-text-image
Question Has Been Solved by an Expert!

Get step-by-step solutions from verified subject matter experts

Step: 2 Unlock
Step: 3 Unlock

Students Have Also Explored These Related General Management Questions!